Chandelier Exit indicator most important facts about this indicator :
- it is a volatility-based indicator so it gives you stop losses as well as exit points in any trade condition that may be buying or selling.
- CE indicator (Chandelier indicator ) developed by Chuk Le Beau he is an expert in exit strategy.
- it is also based on the ATR indicator (Average true range ) ATR gives us a good trend direction with stop-loss that maximizes our profit with limited loss and good accuracy.
- However, this indicator is a combination of stop-loss and exit strategy and if the thing combined in one place it will work well in our trading.
- it works with high and low prices of our defined period means it calculates the value of high and low prices in a period of defined time and then it gives us a CE value.
Using of Chandelier Exit:
- if a trend is going on like an uptrend is happening so in that case when a reversal is like to happen then it gives us an alert for exit from the trade or you can trail your stop loss as the indicator tells you.
- in case of lower volatility days, it gives you a small stop loss so traders can exit from their trades from the top of the market and getting maximum profit.
- in a lower volatility market possibility of a trend reversal is low.
- Most of the traders use chandelier exit as a trailing stop loss so it can protect them from losses due to trend reversals so they quick exit from their trades after following this technique or indicator.
- in this indicator, it’s a mixture of stop loss and volatility so we can easily say that a close relation in both indicators makes a strong exit tool.
The default setting for chandelier exit:
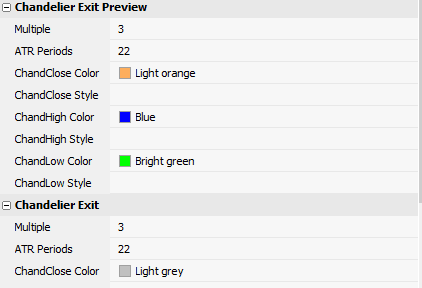
the recommended setting of this indicator is. the period we should use is 22 because in one month there 22-day trading session happens so we should use this for better results . and multiple is 3 times of ATR.
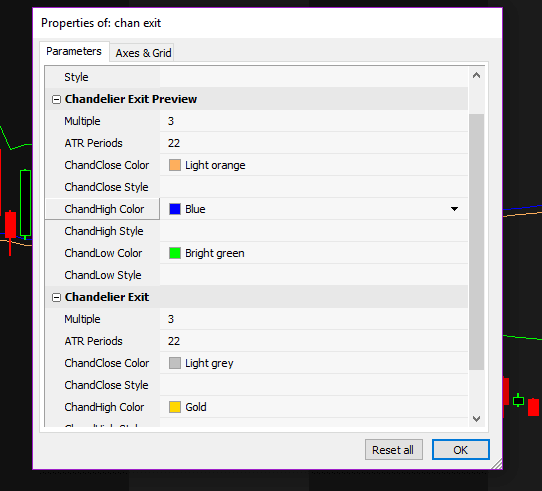
calculations and formulas:
- it has two lines and ATR indicator I am explained below with image
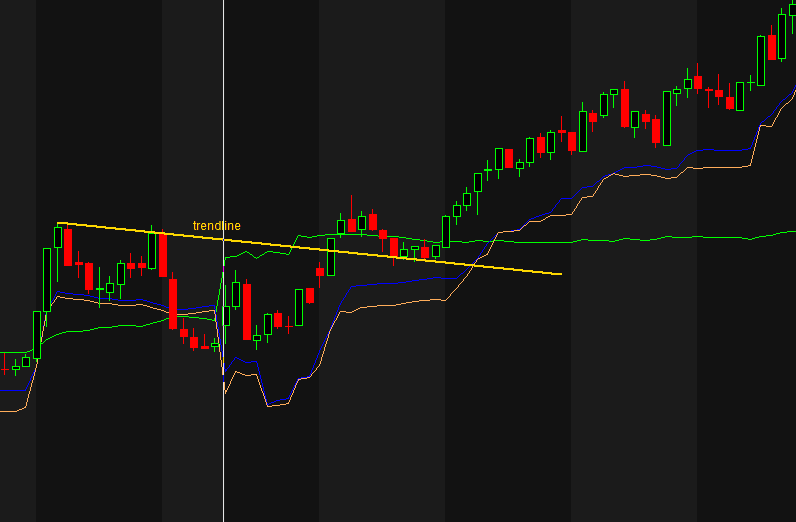
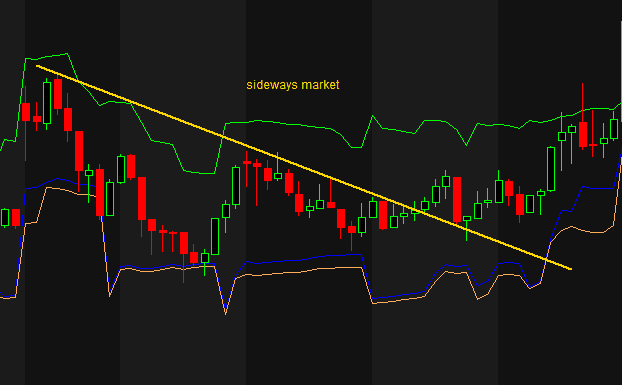
in this image you can clearly see I have drawn a trendline is a good way to identify a trend reversal in this image a breakout happens above trendline and green lines show chandelier low line
so how to filter a trend when 3 of lines below the candle then you can go for buy after checking trendline . now its an uptrend and 3 of line with different color is below the candle and trend reversed and uptrend started .
in this image you can clearly see 3 lines are not below the candle and you can see market is trading in a range so like this you can filter the reversals .
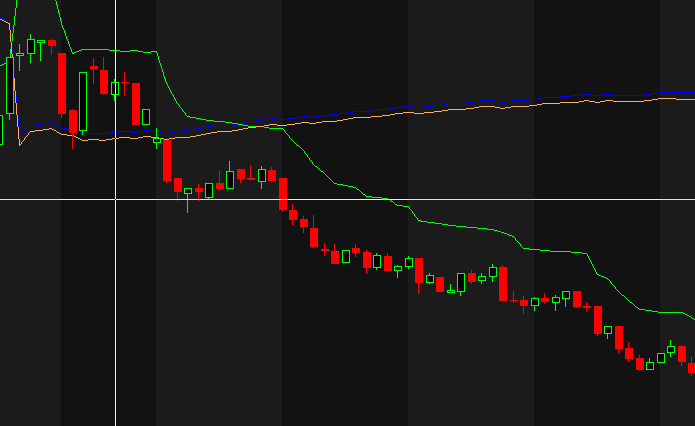
in this image you can clearly see 3 lines are above the candle and green line is working as trailing stoploss and its a down trend market.
“MUST READ”
“for more trading view indicator”
Best Paid Trading view indicator

