×
Divi's Laboratories Technical Anlaysis Today
Divi's Lab Buy Sell signal with Pivot Levels
Sunpharma I Dr Reddy I Divis Lab I Cipla I ORB Stocks I All Stocks

Divi's Lab Support and Resistance I Forecast I Trendline

Divi's Lab 52 Week High Low
[stock_market_widget type="card" template="low-high-indicator" color="#212123" assets="DIVISLAB.NS" display_currency_symbol="true" style="font-size:18px;" api="yf"]
Divi's Lab 50EMA-200EMA I Daily Timeframe
[stock_market_widget type="comparison" template="basic" color="#2C2C30" assets="DIVISLAB.NS" fields="50_day_average,200_day_average" links="{'DIVISLAB':{}}" display_currency_symbol="true" style="font-size:18px;" api="yf" ]
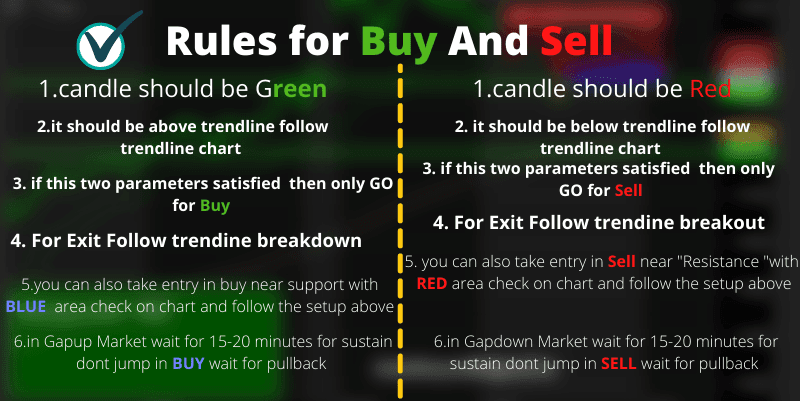
Follow the Rules :-
- It updates in Realtime (5-7 ) seconds .
- we have added so many things to find intraday trend .
- you can easily find intraday prediction based on all tools.
- Technical analysis meter shows you multitimeframe trend of stock it is based on indicators .
- 1st chart that tells you intraday pivot levles with buy and sell signal with target .
- we have clubbed best intraday strategies and made this realtime buy sell signal indcator .
- in the 1st chart you can track many thing like Pivot levels includes ,R1,R2,R3,S1,S2,S3 also added today high low and Previous day high Low .
- 2nd chart shows you realtime support and resistance with trendline breakout breakdown strategy.
- 2nd chart also forecast the trend of stock .
- Added 50 -100 day exponential moving average shows you short term and positional trend,if price above ema trend is up bullish , if price is below ema short term trend is neagative and bearish you should look for short trades .
- Gives you realtime Demand and supply zones that is forming in realtime
- Realtime swing high and swing Low that also tells you about Support and resistance area.
- includes Vwap that triggers Buy and Sell signal
- CCI indicator strategy also put in this chart
- After following this chart you can also trade with futures and also you can trade in options.
- And last but not the least please follow some days for better idea for buy and sell signal.

Must Check This :-Auto Buy Sell Signal Software Tools and free charts
- All stocks ORB Chart
- All Stocks Buy Sell Signal
- Subscribe our Youtube channel
- Mt4 ai based Software
- Best intraday strategy
- Best amibroker afl collection
- Best tradingview indicator
- Free App Download
Disclaimer:- This chart tells you about market trend and based on price action and you can use it for educational purpose . Before taking trade consult your financial advisor .we will not be responsible for your losses. Have a safe trading .
