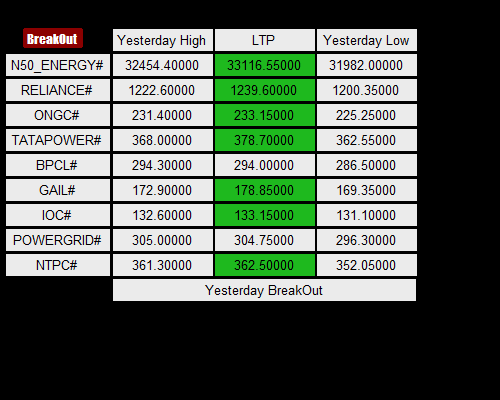
Realtime Nifty ENERGY Screener NSE

Nifty ENERGY Live Charts with Signal Below
Note:-
LTP green = Trading above yesterday high
LTP red= Trading below yesterday low
Neutral (White)= Trading b/w yesterday high and low
🟢 LTP Green: Trading Above Yesterday’s High (Bullish)
Meaning: The market is stronger, with more buying pressure.
Implication: Bullish trend, potential for upward movement.
Action: Consider long positions as the market may continue to rise.
Retesting Strategy: If the price retests the previous day’s high and holds above it, it confirms a bullish breakout. Look for a continuation of the uptrend to enter or add to your long positions.
🔴 LTP Red: Trading Below Yesterday’s Low (Bearish)
Meaning: The market is under selling pressure, and prices are falling.
Implication: Bearish trend, potential for more declines.
Action: Consider short positions or exit long positions.
Retesting Strategy: If the price retests the yesterday low and fails to break higher, it confirms a strong downtrend. Look for additional confirmation (e.g., bearish candlestick patterns) to enter a short position.
⚪ Neutral (White): Trading Between Yesterday’s High and Low (Range-Bound)
Meaning: The market is stuck in a range, with neither buyers nor sellers in control.
Implication: Indecisive market, consolidation phase.
Action: Watch for a breakout or breakdown, or trade the range by buying at support and selling at resistance.
Retesting Strategy: If the price retests the support or resistance within the range and holds, it signals a potential range-bound strategy. Watch for either a breakout above the resistance or a breakdown below support to take action.
Conclusion
🟢 LTP Green: Bullish – potential for upward momentum. If the price retests above yesterday’s high, confirm further bullish strength.
🔴 LTP Red: Bearish – potential for downward movement. A failed retest of yesterday’s low signals a strong downtrend.
⚪ Neutral: Range-bound – waiting for a breakout or breakdown. Retests within the range offer trade opportunities.
Retesting adds an extra layer of confirmation, helping you identify whether the market will continue in the current direction or reverse. Using this strategy can improve your timing and accuracy when entering trades! 🚀📉📈
important instructions
The above NSE nifty ENERGY screener gives you Live nifty ENERGY stocks yesterday high and yesterday low breakout levels, in live market after following this levels you can easily find out the trend of nifty ENERGY .
Trend up= If major ENERGY stocks trades above yesterday high it means trend will be positive.
Trend Down =If major ENERGY stocks trades below yesterday low trend will be negative.
Neutral = If ENERGY stocks trades between yesterday high and low then NIFTY ENERGY INDEX will be act like sideways .
You can also track live nifty ENERGY heat map for today market.


