
✍Stock Analysis for short term DEC 2020
in this ..post we have discussed about 5 stocks .. technical charts with some . explanation please read full post before you invest anywhere . it may be your good pick this time .
1.
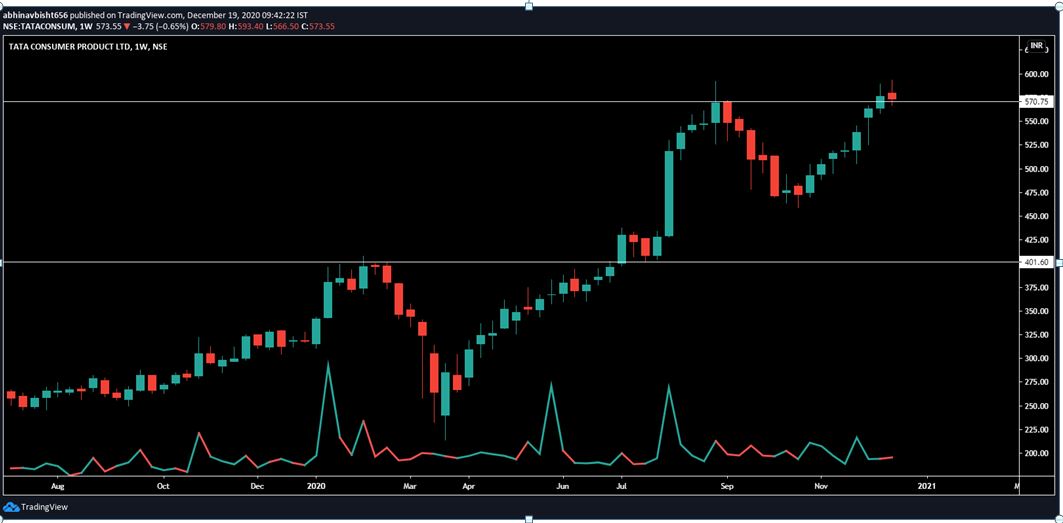
✍Stock: Tata Consumer Product Ltd.
✍Time Frame: Weekly
✍Description: Formation of Higher Highs and Lower Lows gives empowers the security price significantly. The process it follows is, Rally followed by dip/correction till the previous swing high, thus retesting- Sharp upmove after the retest.
The retest at the previous highs gives more confirmation with a better Risk: Ratio in order to get into the trade. Currently speaking, the security price is on the verge of a breakout. With a big bullish monthly closing candle, one can contemplate having another investment opportunity.
With making All-Time High, one can start accumulating on the dips/retest at the previous swing high. A Monthy closing above 600 after a retest, would embark a new journey of the stock to a new destination.
This is absolutely a Positional stock to buy which could give phenomenal returns. Only what one needs to do after investing is, Trailing metal stop loss and pyramiding could help more
2.
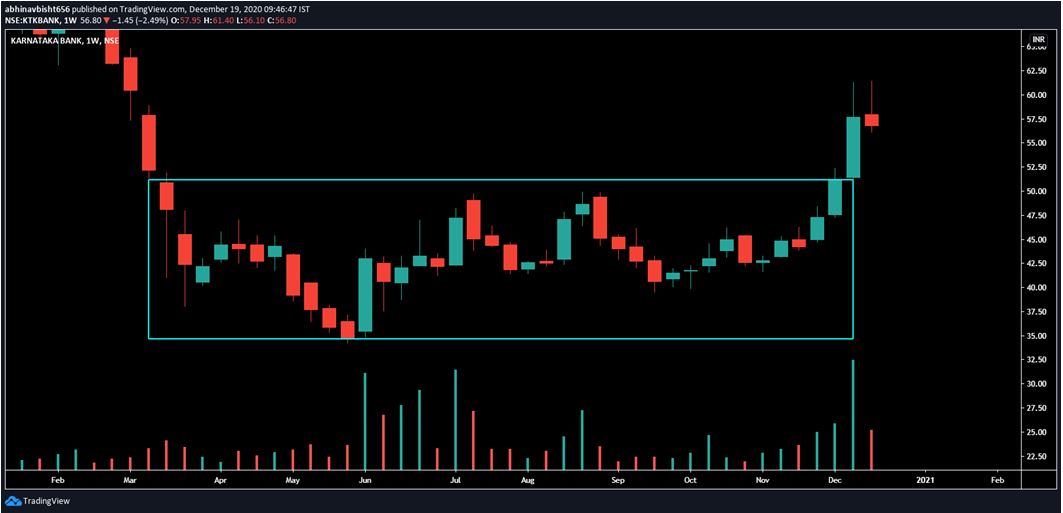
✍Stock: Karnataka Bank
✍Time Frame: Weekly
Description: The stock has broken out from a 10-month long consolidation zone. The stock has crossed measure resistance of 200 Day Moving Average as well as 200 Day Exponential Moving Average, indicating an end of downtrend and establishment of the bottom. Volume outburst too has supported the breakout from consolidation. Moreover, the Relative Strength Indicator also shows a positive signal for the stocks, which would attract more buyers.
A weekly closing above the zone would be a fair indication in order to contemplate investing in the stock. One could aim targets of ₹65 thereabouts, as, the stock has witnessed major reversals from this zone.
3.
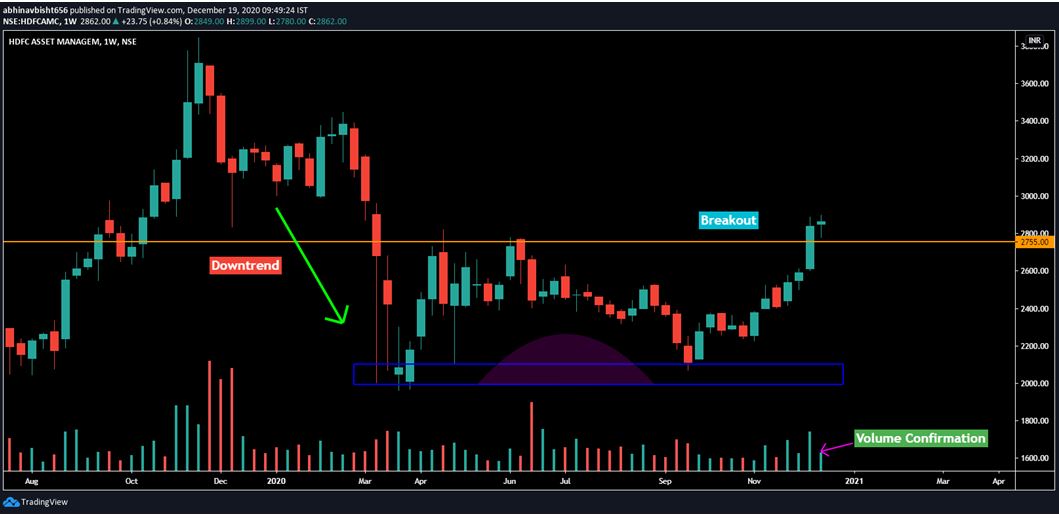
✍Stock: HDFC Asset Management Company
✍Time Frame: Weekly
Description: After the roller coaster ride from the past 2 years, the stock has finally made the bottom of 2020, at the first swing high of its opening price. After the bullish run from September, the stock has now halted above 200 Day Moving Average + 200 Day Exponential Average as well crucial resistance of ₹2755. This could be a good opportunity with stop loss below 200 DMA and targets of ₹3250. The Double Bottom pattern has sufficient potential to thrust the stock price above ₹3000. The weekly closing indicates a good opportunity to have the stock in your portfolio.
4.
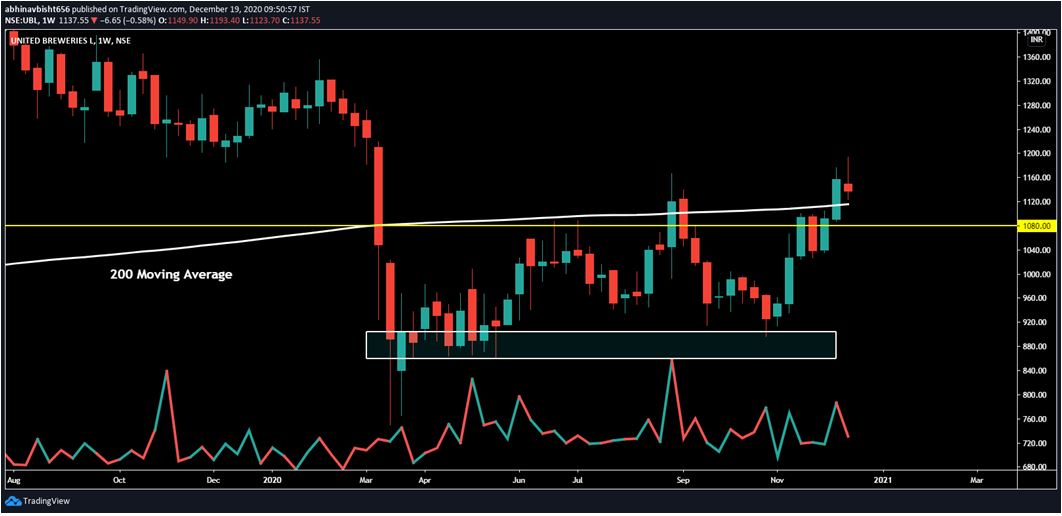
✍Stock: United Breweries Limited
✍Time Frame: Weekly
Description: After finding the “2020 Low” at 50% Fibonacci level from the All Time Low, the security has decided to give a one-sided up move. The bullishness has been established by, not only with 200 DMA but also with 200 Weekly Period Moving Average. Another reason for the bullishness is Double Bottom Weekly Closing above the important zone 1086.
The Risk: Reward right now is in the favour of investors. The security can be bought at the dips until it is above 200 DMA with the target of 1330 on a swing basis.
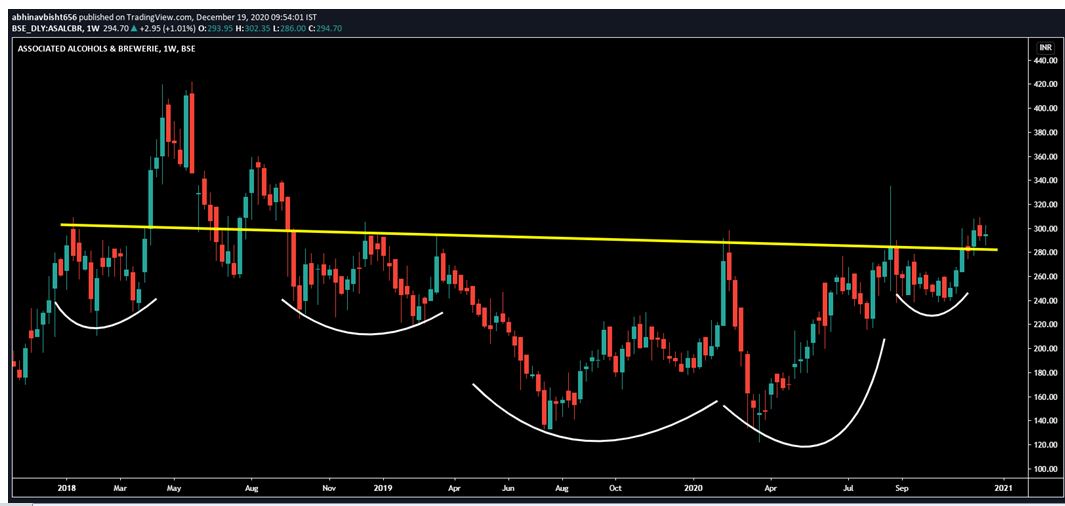
✍Stock: Associated Alcohols & Breweries Limited
✍Time Frame: Weekly
Description: The neckline can be drawn slideways as well as straight near the price zone of ₹295- ₹300. The security price has tried a couple of times to break out of the zone since 2018. A monthly closing with significant volumes can be bought with excellent Risk management with the targets of ₹380 and positional targets above All-Time High above ₹420. The stock has also established Double Bottom, and the upside movement of the security is highly anticipated by the investors.
👉This analysis is shared by one of our subscriber Named chartomania curator (Abhinav) .. thanks for doing this ..
👉search channel on telegram –crudeoilsurecalls ………………………………………………………. LINK- https://t.me/crudeoilsurecalls ✺✺✺✺✺✺✺✺✺✺✺✺✺✺✺✺✺✺✺
👉For daily free crude oil ,Nifty,Banknifty,Stocks,Stock fut calls free .. join  ⇱ CLICK HERE TO JOIN TELEGRAM ____https://t.me/crudeoilsurecalls search channel on telegram –First Learn then Earn
👉 JOIN DISCUSSION GROUP —https://t.me/joinchat/AAAAAFEg1DzO-taZDtvSoQ
For Free__Live discussion in live ___
join our social media accounts… Twitter-https://twitter.com/autobuysellsign
Facebook-https://www.facebook.com/autobuysellsignal.in
linkedin-https://www.linkedin.com/in/autobuysellsignal/
Instagram-https://www.instagram.com/autobuysellsignal/
Pinterest-https://in.pinterest.com/autobuysellsignal/
Disclaimer :– I am not a sebi registered advisor .. its for educational purpose please do your analysis .. before taking any trade ..i will not responsible for any losses you did in this market …..https://autobuysellsignal.in/p/disclaimer.html