×

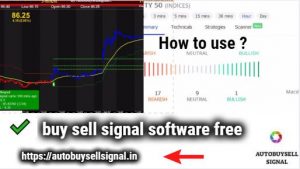
How to use this chart ??AMBUJA CEMENT
✅ First you Need . check Technical Anlaysis Meter
✅ If meter says you to Sell , strong sell and below chart is also Sell then go only for sell
✅ If Meter says you Buy, Strong Buy and chart also says to buy then go only for buy
✅ Chart default time is 15 min ..
✅ For more clearity … check 1 hour time frame for Trend .. If it says you Downtrend but 15 min is uptrend and chart says .. you sell Need to verify.
✅ If you want . good results then .. you need to .. follow 1 hour time frame ..
✅2nd trick for better result is … do Paper trade for almost 5-10 days …before go in live
✅ Do paper trade .. find your profit and losses ,, and then go for any trade …
for more information about this .. mail me @ [email protected]
✅you need to give your time for almost 10-15 days for better results keep patience and have a safe trading ….
✅for live chart of crude oil click here ..
✅for live chart of Bank Nifty click here
✅for live chart of Gold click here
✅for more about intraday trading click here
✅ Amibroker download in free click here
✅discount brokers in india click here
✅ Renko afl download click here
✅ Sgx nifty live chart click here


