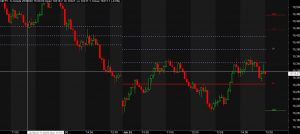
👇Support resitance with Trend finder👇
✔️ Download amibroker that should be any condition trial or registered..
✔️ Install amibroker and .. download this … AFL with given below link ..
✔️ copy afl and paste C:Program FilesAmiBrokerFormulas in any folder or any custom folder ..
👉How to use this afl ???
✔️ Plot this Afl on any company …
✔️you can see the recent support and resistance line how it works ..
✔️ Support == it plots automatically when a nearly low is not broken and this line manages and act this point as a support
✔️ Resitance == it plots automatically when a nearly high is not broken and this line manages and act this point as a Resistance
✔️ You can also find trend by observing candle colors …
✔️if candle is Red then trend is bearish
✔️if candle is Blue then trend is Bullish
✔️Added 20 ema = color is yellow ..
✔️if candle is blue and it is closing above 20 ema and also above resitance so it is a strong uptrend
✔️if candle is red and it is closing below 20 ema and also below Support so it is a strong DOwntrend
✔️ Always use 15 min timeframe for good opportunity ..
✔️DAY SEPERATOR is also added in this afl it will show . you chart .. filter by days …
| Support resitance with Trend finder |
✅you need to give your time for almost 10-15 days for better results keep patience and have a safe trading ….
✅for live chart of crude oil click here ..
✅for live chart of Bank Nifty click here
✅for live chart of Gold click here
✅for more about intraday trading click here
✅ Amibroker download in free click here
✅discount brokers in india click here
✅ Renko afl download click here


