Hello, friends and traders today I am sharing ABFRL (Aditya Birla Fashion and Retail) analysis with full target and stop-loss this analysis is totally based on pure price action .
You can check out our Price action software here –MT4 AI-Based software
This whole analysis is done manually but this MT4 Sofware done this analysis automatically if you are a beginner you must try this for increase your learning and accuracy it works in all timeframes.
Now move to topic ABFRL analysis for short term to medium term .

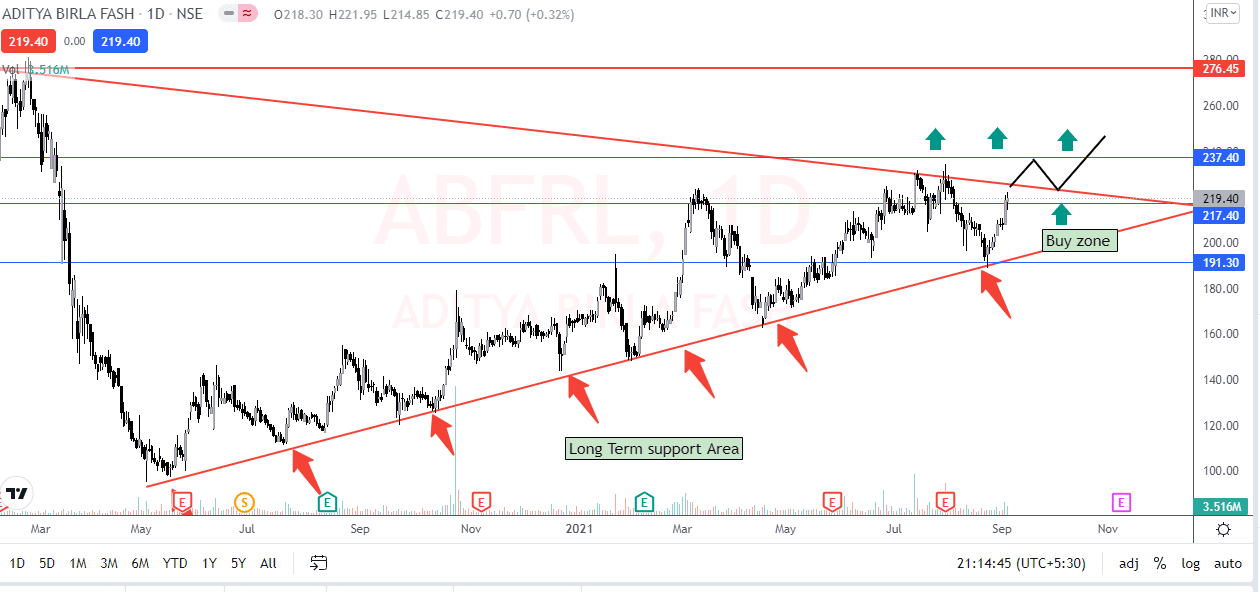
As you can easily check that ABFRL is trading near its resistance zone and also near its upper trendline . 2nd thing ABFRL is making a symmetrical triangle pattern in a daily timeframe and it is trading near this. if this level breaks that lies in the 225-230 zone you can buy near this or wait for a pullback and buy near the 224-226 zone .
- Buy near 224-226 zone
- Stop Loss– Near 190
- 1st target near 237-240 if this levels sustains then you can also see 270-280 zone very quickly
- so keep this stock on your radar for the short to medium term for good returns.
Important Links :-
Free Live MCX 24 App Free Download
for more paid indicators click here
best intraday straetgey click here
Disclaimer : This analysis is totally based on my knowledge and my experience it may give you loss or profit so kindly contact your financial advisor before taking any trade . if you will losse i will not responsible for this .


