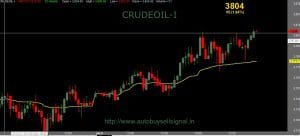
👆Previous Range Breakout
Previous range breakout a golden rule for intraday trading ?
How to Find Levels ?
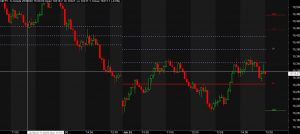
✅so in the above picture … i have drawn a range .. previous day high and previous day low previous day high was 3979 and previous day low .. is 3827 so why we need this range ..??
✅because we are exploring about breakouts and we need range so these two levels will act as range if .
Previous day range wil break either side our strategy will active … if previous day high 3979 i.e high of previous day we need to wait for break this .. other than .
We need to wait for previous day low i.e is 3827 this strategy will active .. so you its mandatory to draw these two lines …
✅These two levels also acts as a support and resitance .. means … our support is 3827 and our resitance level is 3979 so this is the way .. to find support and resistance and .. trade with this strategy is good for intraday …
How this Breakout occurs ?
✅ so in the above picture you can clearly see the breakout happens .. how it works and how it gone up
✅so always keep in mind before you take any trade keep your stoploss .. like wise in image .. always .. take a stoploss below demand zone or near demand zone .. becuase its a good way to .. trade with stoploss
✅ And for taking profits .. you need to draw a trendline and .. if it broke .. exit from that particular trade that you have taken .. in either side
✅ i have discussed 1 scenario that is for buying level .. becuase our high level broke and ..we have taken and enrty with stoploss.
Like wise … if our previous day low will broke .. then we go for short this trade and stoploss will be near swing low candle .
✅ You need to understand the strategy and apply on all stocks commodity whatever you do trade or you want to trade .
✅this is really a good way for intraday trading …
✅you need to give your time for almost 10-15 days for better results keep patience and have a safe trading ….
Free Live charts
✅for live chart of Bank Nifty Open this Link
✅for more about intraday trading click here
✅ Amibroker download in free click here
✅discount brokers in india click here
✅SGX nifty Live chart Open this
Must read Also :-
In this blog you will get Amibroker Afl files amibroker download Eod downloader for historical data in free ..
✔️Disclaimer :- Intraday trading is very risky so be cautious and .. before go in live first do demo trade on paper.
👇Need to try all intraday strategy all setting of indicator that will work for you …
good indicators … list that is good for intraday trading …
1. EMA (Exponential moving avearge )
2. MACD ( Moving Avearge convergence divergence )
3. Support and resistance (Not an indicator but its a great way to find supply and demand zone)
4. Pivot points … its also a good tool for .. find out near support and resistance it includes in all trading platform ..


