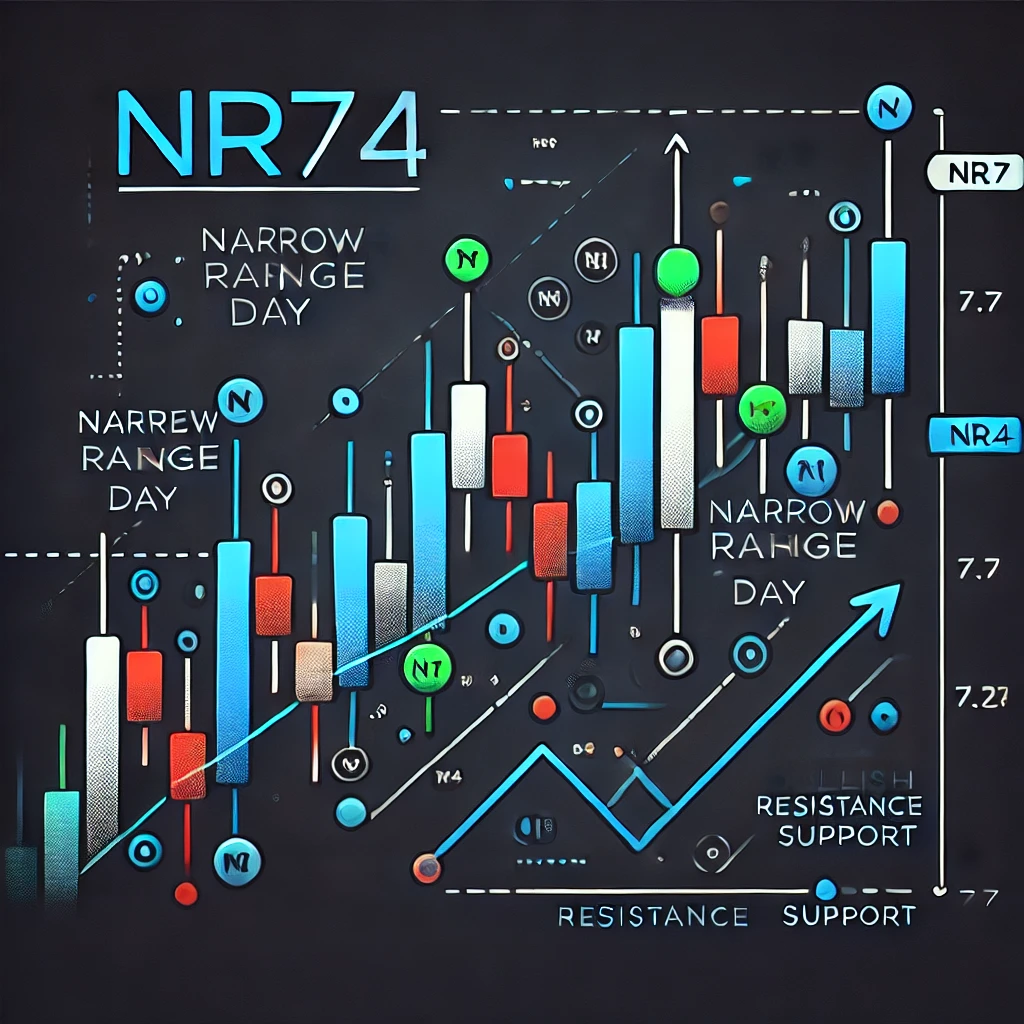
What is nr4 and nr7 Intraday Trading Strategy ?
What Are NR4 and NR7 Days in Trading?
An NR7 day is when the price range—defined as the difference between the day’s high and low—is the narrowest compared to the last seven trading days. Similarly, an NR4 day has the narrowest price range within the last four trading days.
These patterns are important because they signal periods of consolidation, often followed by significant breakouts.
- A bullish setup occurs when the price breaks out above the high of the nr7 strategy candle or NR4 candle, indicating potential upward momentum.
- Conversely, a bearish setup happens when the price breaks below the low of the NR7 or NR4 candle, signaling potential downward movement.
By identifying these setups, traders can position themselves to take advantage of the strong price movements that typically follow such consolidations.
How to Identify an NR4 Pattern Day
An NR4 day pattern is when the price range for the day is the narrowest in the last four trading days. Follow these steps to identify it:
- Collect Data: Gather the high and low price data for the last four trading days.
- Calculate the Daily Range: For each of the four days, calculate the range using the formula:
Range = High – Low - Compare the Ranges: Compare today’s range to the previous three days’ ranges.
- Confirm the NR4 pattern: If today’s range is the smallest among the four days, it is an NR4 day.
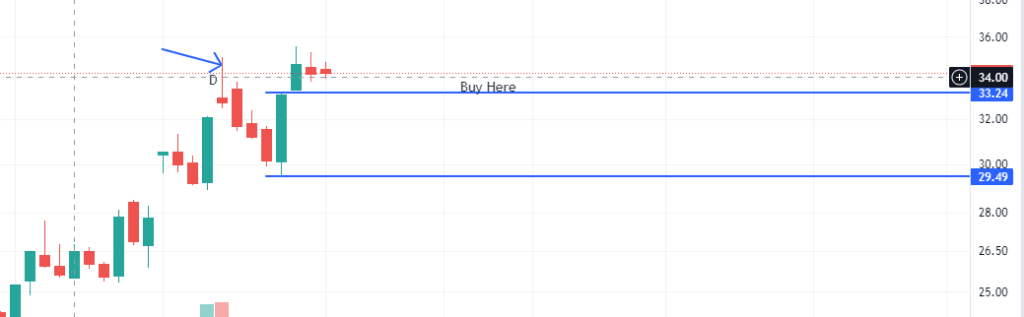
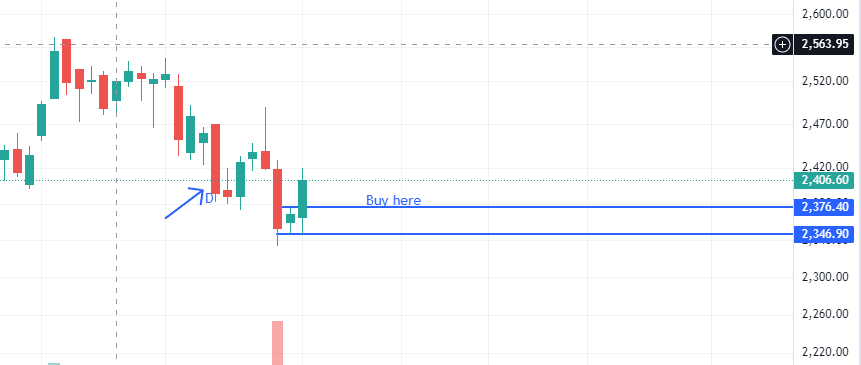
- Once you find that day please draw a high and low range on that particular candle for entry.
How to Identify an NR7 Pattern Day
Spotting an NR7-day pattern is straightforward if you follow these steps:
- Gather the Data: Collect the high and low price data for the stock over the last seven trading days.
- Calculate the Daily Range: For each day, find the range using the formula:
Range = High – Low - Compare the Ranges: Look at today’s range and compare it to the ranges of the previous six days.
- Confirm the NR7 Pattern: If today’s range is the smallest among all seven days, it qualifies as an NR7 day. If not, it doesn’t.
- Once you find that day please draw a high and low range on that particular candle for entry.
What is the NR7 Strategy?
The NR7 Strategy stands for “Narrow Range 7,” a popular trading strategy used by traders to identify potential breakout opportunities in the stock market. It focuses on spotting the narrowest trading range of the last seven trading sessions. This strategy is widely recognized for its simplicity and effectiveness in detecting low-volatility periods that are often followed by significant price movements.
How Does the NR7 Strategy Work?
The NR7 Strategy revolves around the concept of contraction and expansion in market movements:
- Contraction Phase: A stock’s price enters a narrow range, signifying low volatility.
- Expansion Phase: Once the narrow range phase is complete, a significant price movement is likely to follow.
Traders use the NR7 strategy to anticipate these expansions and position themselves accordingly.
Steps to Identify NR7 Days
- Collect Data: Gather the high, low, and closing prices for the last seven days.
- Calculate Range: Subtract the day’s low from the high for each of the seven days.
- Compare Ranges: Identify the day with the smallest range.
- Mark the NR7 Day: If today’s range is the narrowest among the last seven days, it is classified as an nr7 current day.
How to Trade Using the NR7 Strategy
- Breakout Confirmation: Wait for a breakout above the high or below the low of the NR7 day.
- Volume Analysis: Higher trading volumes during the breakout confirm its strength.
- Set Stop-Loss: Place a stop-loss just below the low (for long trades) or above the high (for short trades) of the NR7 day.
- Target Price: Use support/resistance levels or a risk-reward ratio to determine your target.
Advantages of the NR7 Strategy
- Early Entry Points: Helps traders enter trades early in breakout moves.
- Risk Management: Defined stop-loss levels minimize potential losses.
- Simplicity: Easy to implement without requiring advanced technical knowledge.
- Versatility: Works well across different market instruments and timeframes.
Limitations of the NR7 Strategy
- False Breakouts: Not all breakouts after an NR7 day result in strong price movements.
- Requires Confirmation: Volume or other indicators are needed to confirm the breakout.
- Dependent on Market Conditions: May not work effectively in highly volatile markets.
Example of NR7 Strategy
Let’s say a stock has the following price ranges over the last seven days:
| Day | High (₹) | Low (₹) | Range (₹) |
|---|---|---|---|
| 1 | 200 | 190 | 10 |
| 2 | 210 | 200 | 10 |
| 3 | 215 | 205 | 10 |
| 4 | 212 | 207 | 5 |
| 5 | 220 | 215 | 5 |
| 6 | 225 | 215 | 10 |
| 7 | 230 | 220 | 10 |
On Day 4, the range (₹5) is the smallest of the last seven days. Traders would monitor Day 4’s high and low to identify potential breakouts in subsequent days.
How to Use the NR7/NR4 Trading Strategy
The NR7/NR4 strategy helps traders identify nr4 breakout and nr7 breakout opportunities based on narrow price ranges. Here’s how to apply it for both bullish and bearish setups:
Bullish Setup
- Identify the NR7/NR4 Day: Use the steps mentioned earlier or a charting tool to find the narrow range day. If the current day is an NR7 or NR4 day, prepare for a potential breakout.
- Enter a Buy Position: Place a buy order when the price moves above the high of the narrow range day.
- Set a Profit Target:
- Book profits near the next resistance level.
- Alternatively, use a percentage-based profit target based on your trading plan.
- Apply a Trailing Stop-Loss: Use the Parabolic SAR (10, 0.4) to set up a trailing stop-loss to protect your gains as the trade progresses.
Bearish Setup
- Identify the NR7/NR4 Day: As with the bullish setup, determine if the current day is an NR7 or NR4 day.
- Enter a Short Position: Place a sell order when the price moves below the low of the narrow range day.
- Set a Profit Target:
- Aim for the next support level as your price target.
- Alternatively, use a percentage-based profit target.
- Apply a Trailing Stop-Loss: Use the Parabolic SAR to manage your stop-loss and protect against reversals.
Features of the NR4 and NR7 Live Breakouts
The NR4/NR7 live breakout screener is a powerful tool for identifying stocks in narrow-range breakout setups during live market hours. It lists stocks that were in a narrow-range breakout list at the end of the previous day and have crossed the high or low of the NR candle during the live market. Here’s a breakdown of the key features and data provided:
Key Features and Data for NR4/NR7 Intraday Trading Strategy
- Symbol
- Represents the stock symbol.
- Clicking on the symbol provides detailed information about the stock.
- LTP (Last Traded Price)
- The price at which the most recent trade occurred between a buyer and a seller on the stock exchange.
- The LTP value changes dynamically during live trading.
- OI (Open Interest)
- Represents the number of outstanding futures or options contracts in the market.
- A useful metric for gauging market activity and sentiment.
- NR9 (Narrow Range 9)
- Indicates a stock that has formed its smallest price range (High – Low) in the last 9 trading days.
- NR7 (Narrow Range 7)
- Highlights stocks that have recorded their narrowest price range in the last 7 trading days.
- NR4 (Narrow Range 4)
- Marks stocks with the smallest price range in the past 4 trading days.
- Inside Bar
- Refers to a candlestick that forms entirely within the high and low range of the previous candle.
- This often signals indecision or potential for a breakout.
By using the NR4/NR7 screener, traders can efficiently track stocks with significant breakout potential and make more informed trading decisions.
Conclusion:- This NR4/NR7 Intraday Trading Strategy stocks you can clearly check on the internet,as of now we are providing you with some websites that give you real-time nr4 scanners or nr7 scanners which provides nr4 stocks for tomorrow for free here you can follow wesbsite.