
Adani Ports Sez 5 min ORB Realtime chart
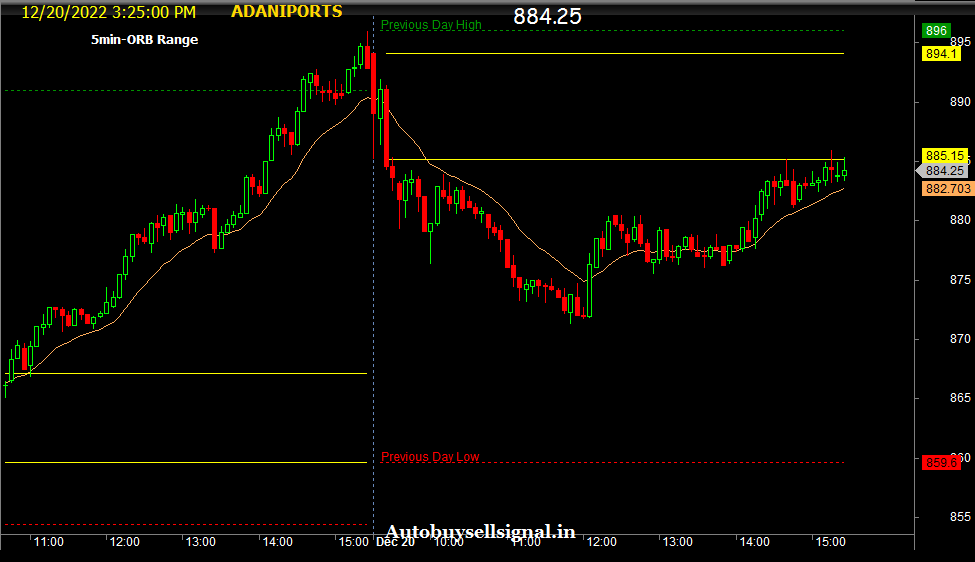
- Color code –
- 1st 5min candle day high value – Yellow Horizontal Line
- 1st 5min candle day Low value- Yellow Horizontal Line
- Previous day high – Green dotted Line
- Previous day Low- Red dotted Line
- 9ema – Orange color
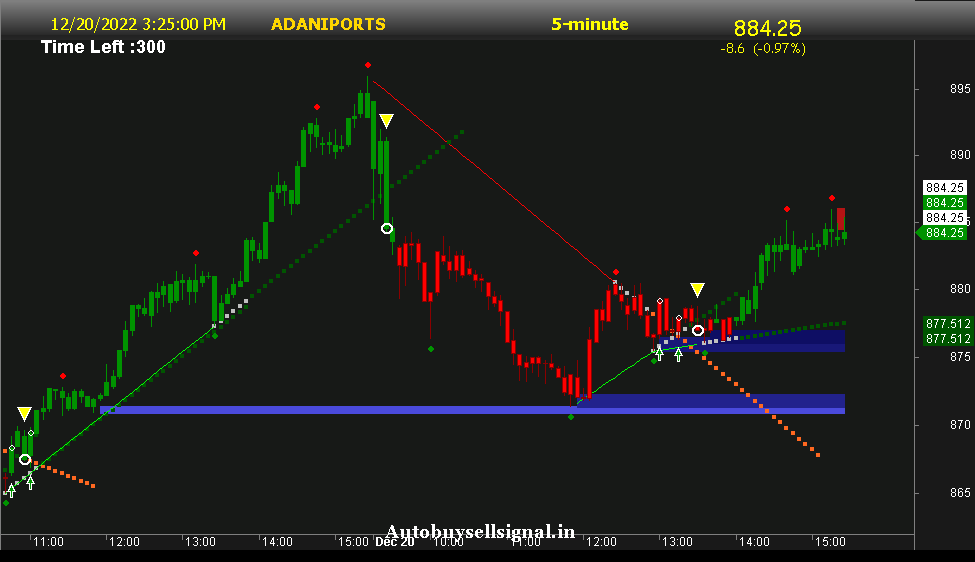
Adani Ports Sez support and Resistance with live chart
How to Use this Adani Ports Sez ORB Chart ?
Also Read this :- Realtime Mentha oil Rate chart with analysis
- ORB means opening Range breakout .
- We have added 5 min opening range means 5 min candle high low .
- if market holds 5 min high then market may be go up .
- if market break 5 min low .. then market may be go down .
- we have added previous day high and low .
- Previous day high low works as support and resistance .
- If previous day high was broken market may be go more up otherwise if this levels didnt hold market may fall near previous day high and works as resistance.
- If previous day low was broken market may go more downside , or if this level hold market takes support from previous day low and work as support .
- we have also added 9 ema which help you in entry and exit if candle below 9 ema you should short and wait with trail your stop loss as per 9 ema .
- Buy – candle should be above 9 ema . Sell- candle should be below 9 ema .
- 2nd chart tells you about whats the trend for today with support and resistance.
- it also gives you trendline breakout and breakdown you can use this area for entry and exit .
Disclaimer:- This chart tells you about market trend and based on price action and you can use it for educational purpose . Before taking trade consult your financial advisor .we will not be responsible for your losses. Have a safe trading .