
MCX Natural Gas Trend Today
MCX Natural Gas Pivot levels I Forecast I Target

MCX Natural Gas Trend today I support and Resistance/prediction
Also Read this :- Realtime Mentha oil Rate chart with analysis
How to Use this Natural Gas Buy Sell signal chart ?
- Mcx natural gas lot size is 1250 so if you buy one mcx natural gas lot means you have bought 1250 quantity .
- If price goes 1 rupess up or down you will get 1250 rupess in profit or loss whatever you predict .
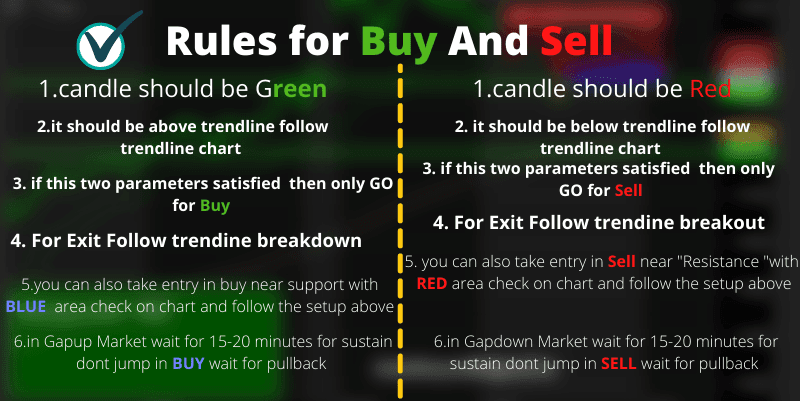
- This Whole chart is Based on Price action Technique .
- It tells you realtime trendline breakout breakdown .
- Gives you realtime Demand and supply zones that is forming in realtime
- Realtime swing high and swing Low that also tells you about Support and resistance area.
- includes Vwap that triggers Buy and Sell signal
- CCI indicator strategy also put in this chart .
- So we have almost added too many strategies in this chart for better trend capture .
- After following this chart you can trade with Nifty futures and also you can trade in options.
- Follow my video instruction for how to use it in realtime .
- And last but not the least please follow some days for better idea for buy and sell signal.
- Buy and sell signal is not good it may give you big losses so that why you should focus on price action .
- For more you can also use our MT4 software for better knowledge and trading experience .
Disclaimer:- This chart tells you about market trend and based on price action and you can use it for educational purpose . Before taking trade consult your financial advisor .we will not be responsible for your losses. Have a safe trading .