
Bitcoin price Realtime
Bitcoin analysis Technical Analysis
Technical analysis for Bitcoin price :
The pivot point in the above chart:-when the price is still trading above the pivot point you should always go for the target R1 and R2 . Likewise, when price trades below pivot point you should go for short opportunities.
Note:- This style suits for more probable for intraday traders he must follow this type of strategy for bitcoin prices.
Hold the position in bitcoin:-in In the technical analysis meter you can clearly see there are many timeframes are there but which timeframe you should follow for holding a position in bitcoin so if your duration is like 4-5 months to 1 year.
- you should follow the monthly-weekly-daily timeframe if in three of them technical analysis says you for buy so you should the position otherwise if anyone does not match the trend then you should exit the position.
- Try to plot a trendline to confirm the trend
- there are so many intraday strategy you can use them
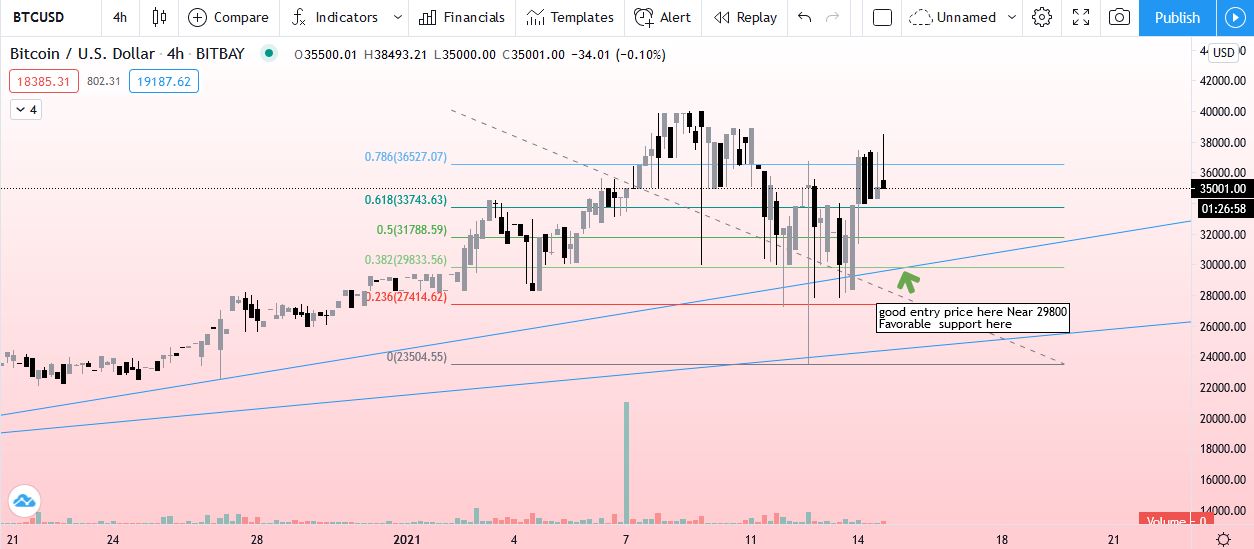
 In the above image, you can clearly see I have drawn two trendlines that show you a good entry point for bitcoin this time you should wait and buy near 29800. So now the trend is some fall is showing in bitcoin
 - in the image tools i have used and indicator i have used
- Trendline
- Fibonacci ratio
- You can also draw 200 ema now the current price of 200 ema is the 28500-good price for buy bitcoin.
“Must read:1. Best intraday strategy”
 In the above image, you can clearly see I have drawn two trendlines that show you a good entry point for bitcoin this time you should wait and buy near 29800. So now the trend is some fall is showing in bitcoin