💥Recent Support and Resistance AFL
How to plot and use?
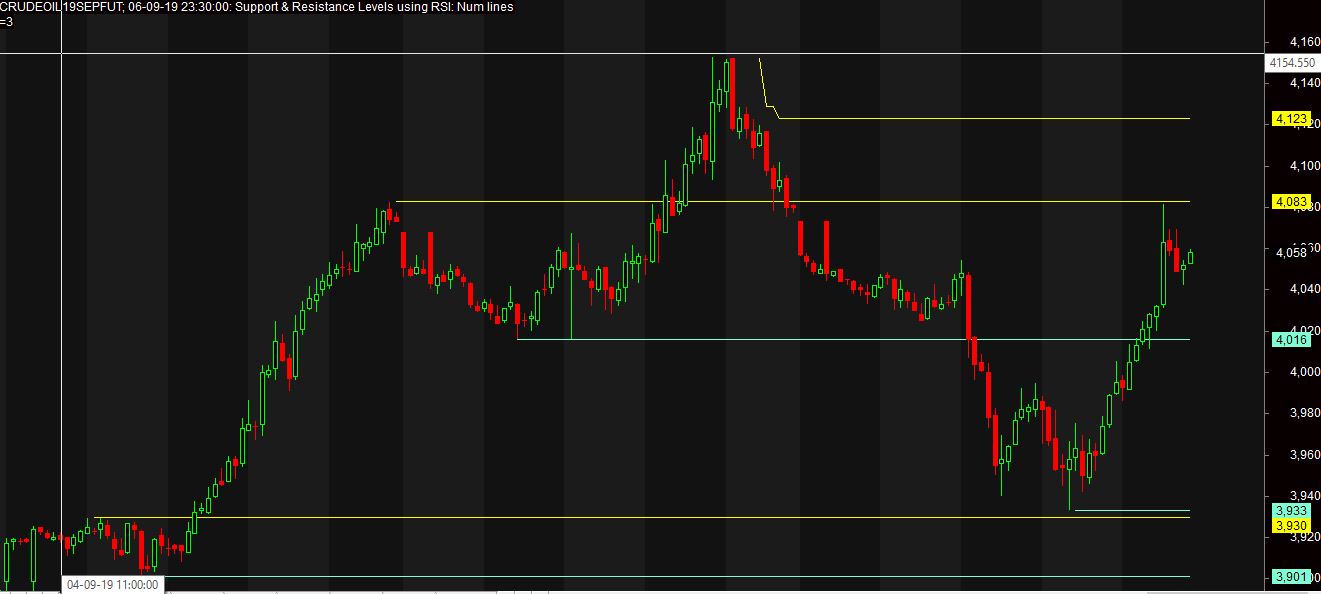
✅ In the above image, you can clearly see the recent support and Resistance AFL.
✅ yellow and green horizontal lines act as support and resistance.
✅ So how it works and why we should use this Afl for the quick support and resistance on one page.
✅ When you apply this Afl on any Scrip i.e– Commodity, equity, options anyone.
✅ First, you need to see recent support and resistance with their price in the above image 4083 is the immediate resistance and it will act as an immediate resistance just wait for a break this after that go for any trade because after breaking resistance price can go higher and higher if it does not break this Resistance 4083 then you should wait and price can go further down.
✅ Now its time to see what is the immediate support so for this you can see the blue horizontal line as shown in the above image and the price is 4016 so this is the immediate support again if
this level sustain then price can go up from 4016 to ➕➕➕➕ other than if it breaks this level then it can go their next support that is 3930-3933 as shown in the image.
✅ SO friend please download this from the below-given link and apply this AFL to any chart and find immediate support and resistance in an easy way.

✅for a live chart of crude oil click here.
✅for the live chart of Bank Nifty click here
✅for the live chart of Gold click here
✅for more about intraday trading click here
✅ Amibroker download in free click here
✅discount brokers in India click here
✅ Renko afl download click here
In this blog, you will get Amibroker Afl files amibroker download Eod downloader for historical data in free.
✔️
Disclaimer:- Intraday trading is very risky so be cautious and .. before going into live trade first do demo trade on paper I mean to say if you want to improve your intraday trading you need to practice more and more and for almost 10-15 days it will improve your work.
👇
Need to try all intraday strategy all setting of indicator that will work for you …
good indicators … a list that is good for intraday trading …
1. EMA (Exponential moving average )
2. MACD ( Moving Average convergence divergence )
3. Support and resistance (Not an indicator but it’s a great way to find supply and demand zone)
4. Pivot points it’s also a good tool for .. find out near support and resistance it includes in all trading platform.
5.. It’s enough .. don’t use so many indicators…. next post. I will share a new strategy that will work intraday.