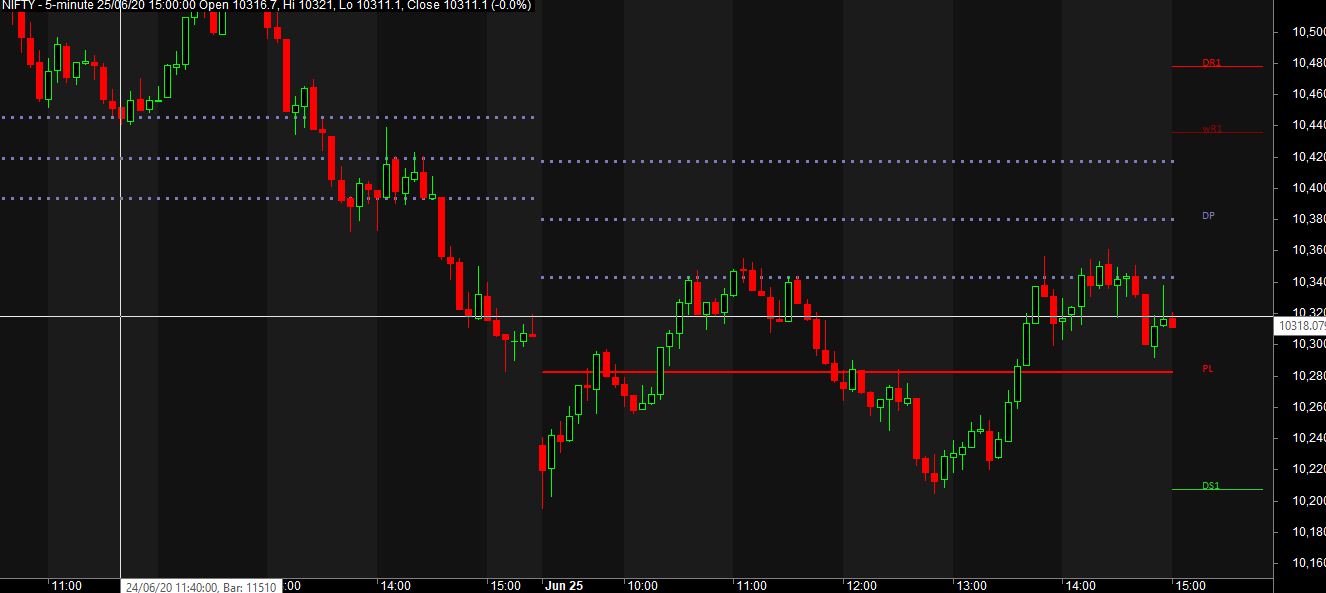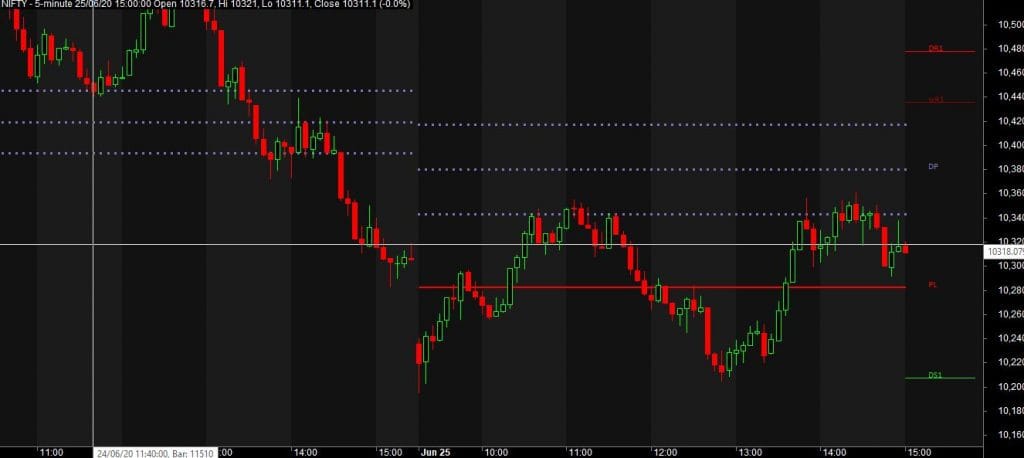
if you are a trader then you have used it earlier or you have planned for using this indicator in this blog. This is the best technical indicators for day trading based on price action .
we will discuss about CPR indicator and its application and how to use this cpr intraday strategy and what’s the method for using it in intraday trading as well as positional trading.
There are different application that is used by intraday traders like in pivot point you have seen 3-4 types of pivot point classifications like standard Fibonacci and normal among of these indicators and types Central pivot range ( cpr in trading ) is mostly used indicator by traders.
what is cpr in stock market?
it identifies the levels of any security(stocks, commodities, and futures any anyone). It’s the most valuable indicator mostly used by traders (intraday trading) but in this post, we will try to some hidden things some tricks that you can use for Positional trading or for short-term trading.
How to use cpr indicator?
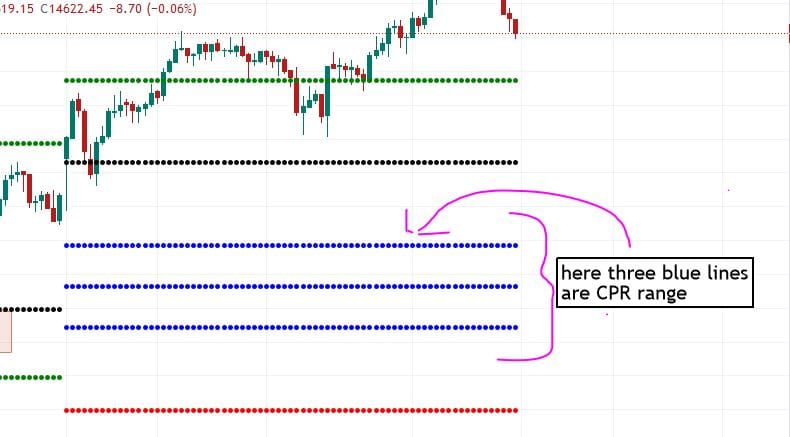
in the above image, you can clearly see there are three blue lines that show you the central pivot range so why this range is important and why we need to observe this range.
three blue lines show us a psychological level where the market may come and bounce from there means it works as support and resistance when market trades above this most times you can take long trades means you can buy and if the market trades below this range so that time acts as a resistance and can initiate sell trades as well.
we can also define this range in a different way means these three lines are average price and if the market is still above this average price you can go long and vice versa.
Now again you can use its vice versa for sell trades as well and go for targets S1, S2, S3.
Booking profits: where we can book our profits
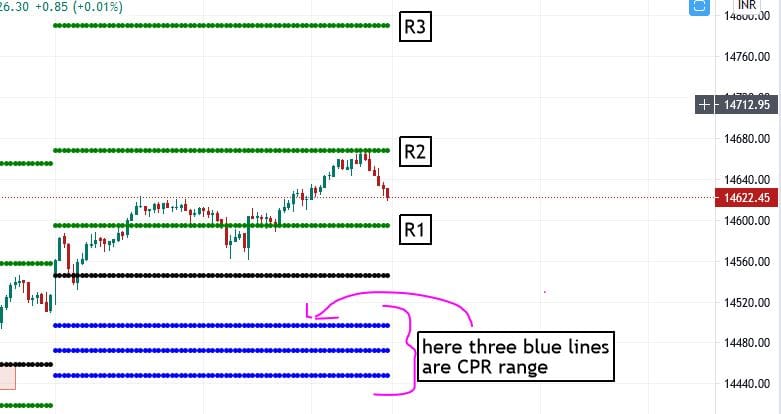
in the above image, you can clearly see that I have marked three ranges R1, R2 , R3.
Whats these levels there are the levels you should consider for your profit booking in buy-side R1-resistance one as well as target one again trail your stop loss and go for R2 in a trending market. safe traders can exit.
calculation of cpr pivot formula
how to calculate CPR? ( CPR range )
- PP =PIVOT POINT ((High + Low + Close)/3
- BC =BOTTOM CHANNEL/BOTTOM PIVOT RANGE=(High + Low)/ 2
- TC =TOP CHANNEL/ TOP PIVOT RANGE=(Pivot – BC) + Pivot
As you have seen the CPR calculation formula what’s the logic behind this formula in this formula you can observe a term that is using high, low, close this value is taken from the previous day’s price.
This means you can also apply this formula by adding and the result is whatever you got means it totally an average of the previous day.
So on the basis of previous day data this CPR indicator works and it gives Us a range of where the market may go and where the market takes to support as well as resistance its the main working principle of this and now it’s used by most active traders and its the main thing for being popular in between intraday traders.
Pull Back strategy in CPR
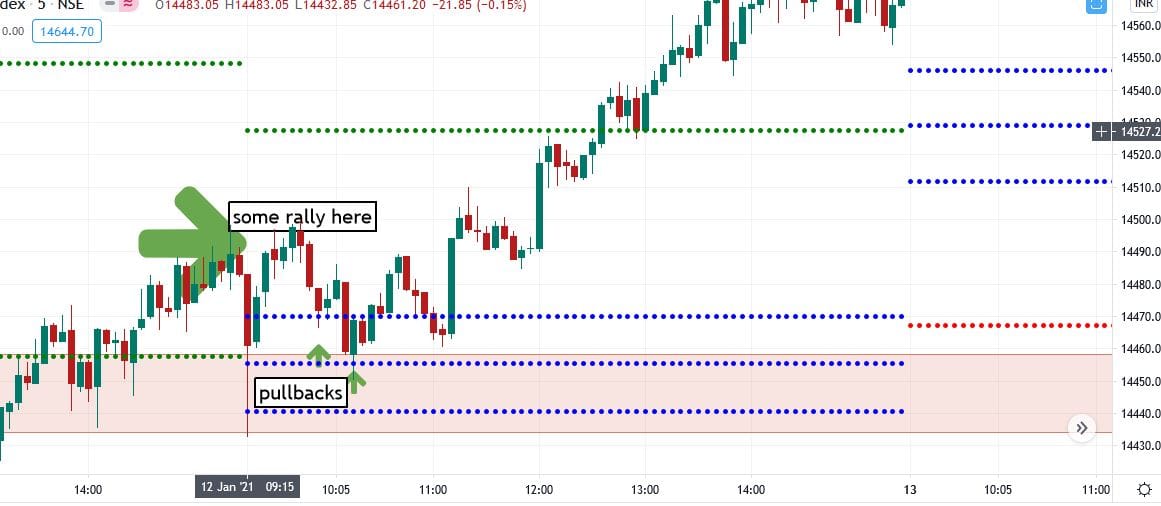
| Bullish move:-if the market shows rally very quick and its above TC so wait until it will come down and buy near pullbacks as I shown in the image so we should wait for a retracement and then we can enter with stop loss and keep your stop loss at the bottom channel (BC). |
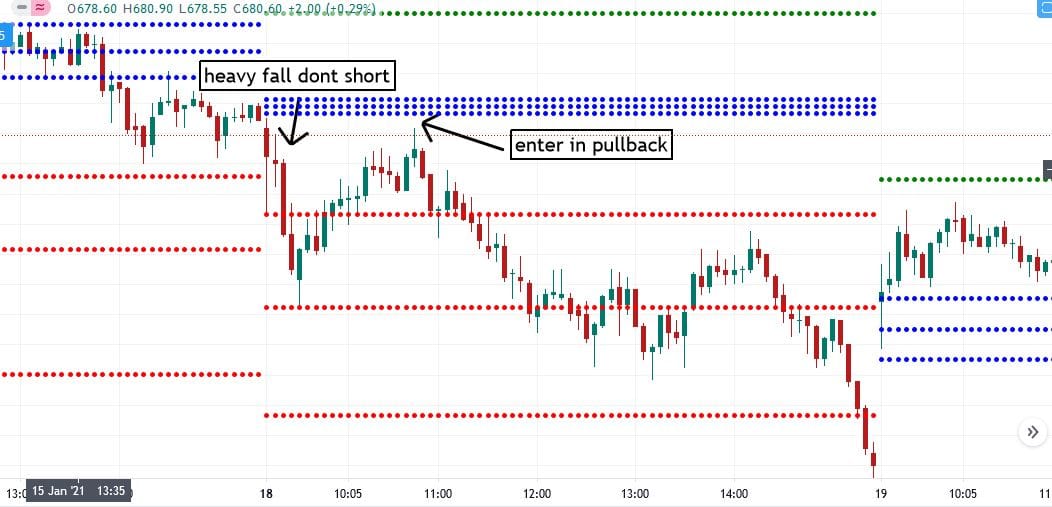
| Bearish move:-if the market shows a quick fall and it below BC so wait until it will go up and sell near pullbacks as I shown in the image so we should wait for a retracement and then we can enter with stop loss and keep your stop loss at the PP or TP. |
Conclusion:-
if you want to increase your success ratio in the stock market so you can use this central pivot range trading strategy ( cpr strategy ) it is totally based on simple price action . Combined this with volume and analyze for some days weeks and then trade with this in live.Always try to keep stop loss because the market is unpredictable so keep this logic in your mind and do practice as much as you can. one more you should also know about this its the best indicator for intraday trading among of all available indicators in the market so do practice more be confident .
IF you want to more about simple CPR indicator how it works ..
please watch this all video for a better understanding
“Must read:1. Best intraday strategy”
3.Best Paid Trading view indicator
4.Free Realtime Buy sell signals

