MCX Copper Live chart I Historical chart
MCX Copper Price Today
MCX Copper Intraday Realtime Live chart I Buy Sell signal
MCX Copper Trend Today I Support and Resistance
How to Use this MCX copper live chart ?

Mcx Copper Lot size
Changing 1 point in mcx Copper you will get 100 rupees respectively as per lot size .
| COPPER | 1 MT | 1000 |
| COPPERM | 250 KGS | 250 |
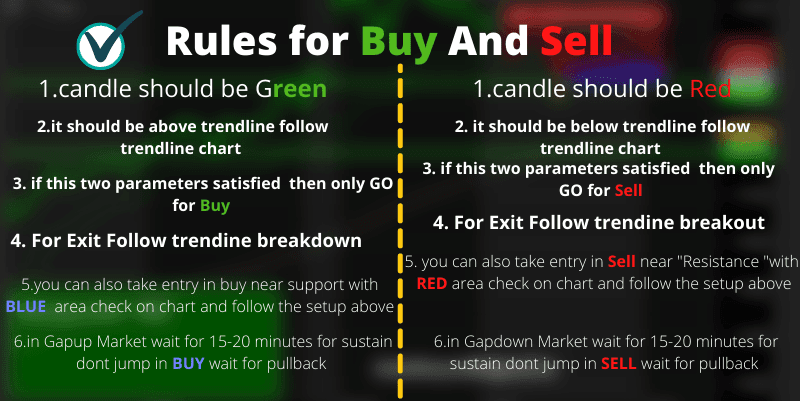
MCX Copper chart Rules :-
- At the top we have added mcx copper live candlestick chart there you can check live streaming of mcx copper live price and you can also check historical chart up to many years .
- First we should know about mcx copper lot size -so the lot size of mcx copper is 100, it means if copper moves 1 point up or down you will get 100 rupees.
- We have also added here investing chart of copper so you can also check copper chart upto 10 years and more historical chart.
- This Whole chart is Based on Price action Technique .
- It tells you realtime trendline breakout breakdown .
- Gives you realtime Demand and supply zones that is forming in realtime
- Realtime swing high and swing Low that also tells you about Support and resistance area.
- includes Vwap that triggers Buy and Sell signal
- CCI indicator strategy also put in this chart .
- So we have almost added too many strategies in this chart for better trend capture .
- Follow my video instruction for how to use it in realtime .
- And last but not the least please follow some days for better idea for buy and sell signal.
- Buy and sell signal is not good it may give you big losses so that why you should focus on price action .
- For more you can also use our MT4 software for better knowledge and trading experience .
Disclaimer:- This chart tells you about market trend and based on price action and you can use it for educational purpose . Before taking trade consult your financial advisor .we will not be responsible for your losses. Have a safe trading .


