
Updates daily After market (3:30 pm)
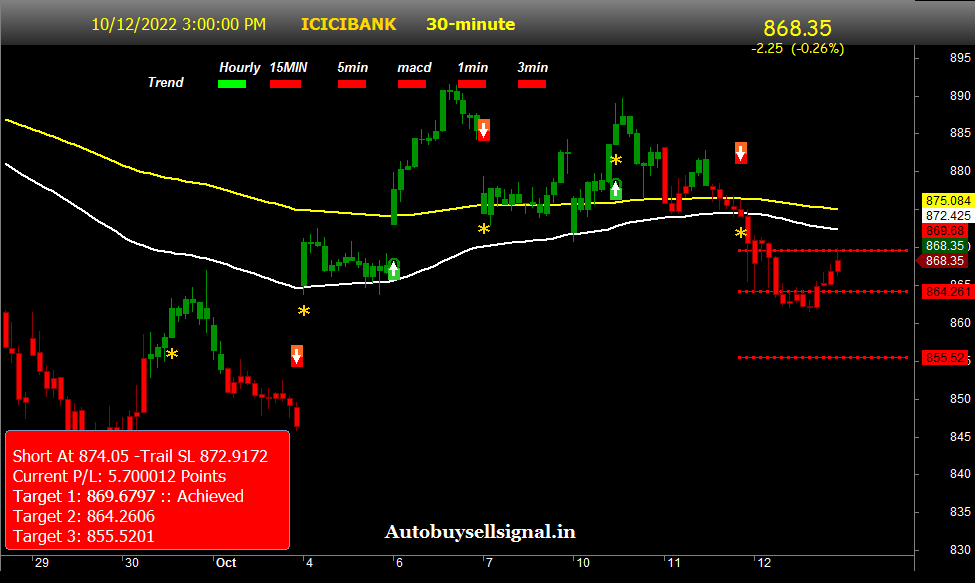
ICICI BANK weekly Monthly Pivot Levels I Forecast I Target I 30min Timeframe
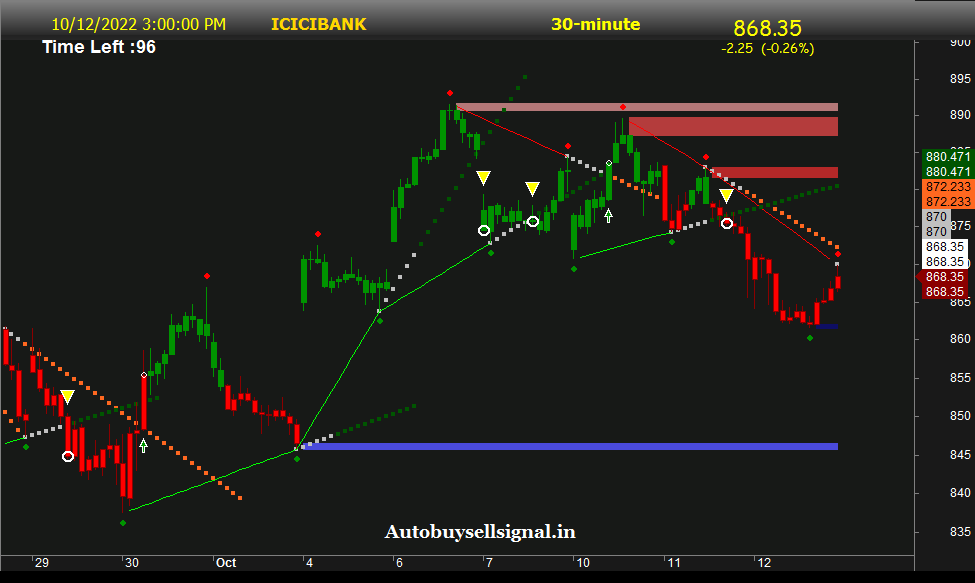
ICICI BANK Support and Resistance with Trendline I 30min Timeframe
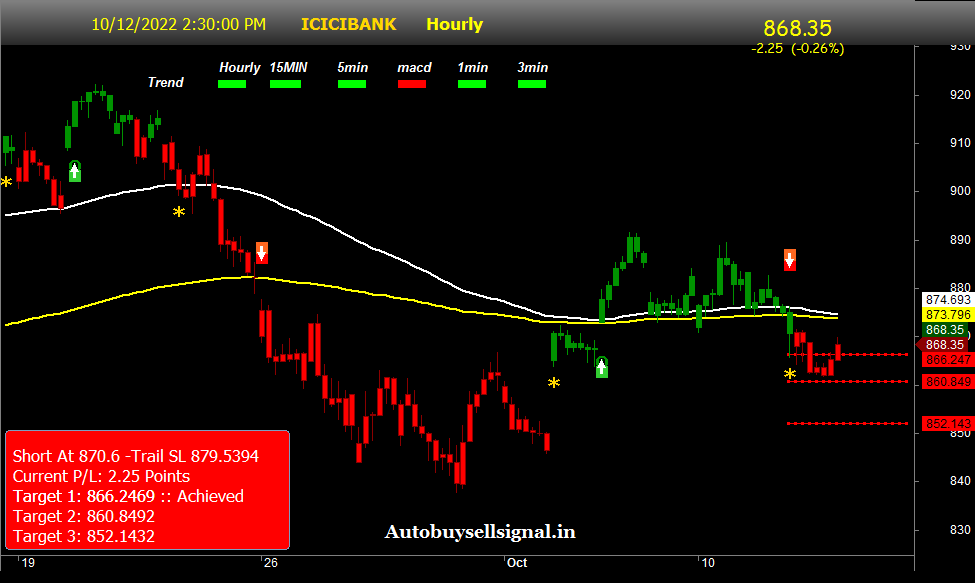
ICICI BANK weekly Monthly Pivot Levels I Forecast I Target I 1hour Timeframe
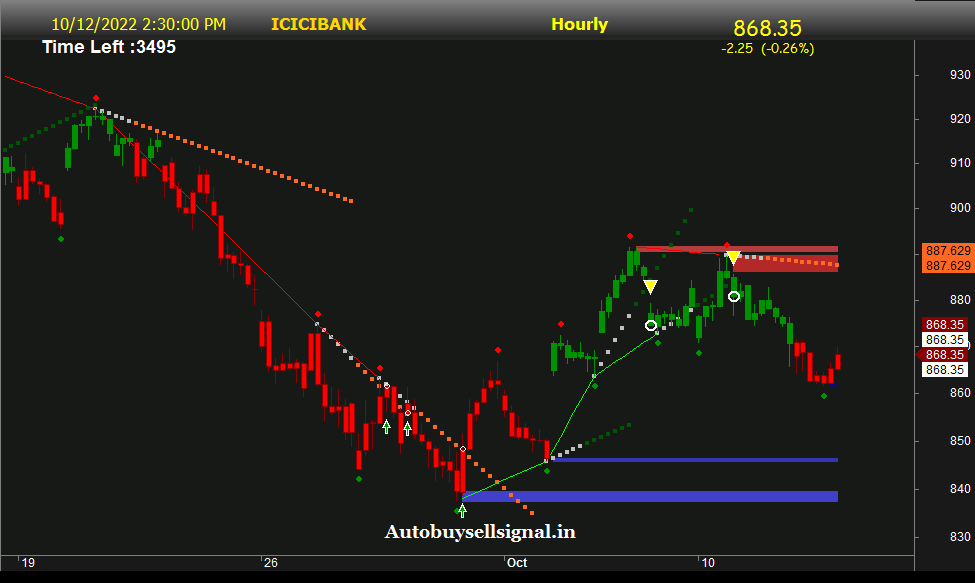
ICICI BANK Support and Resistance with Trendline I 1hour Timeframe
ICICI BANK 52 Week High Low
[stock_market_widget type="card" template="low-high-indicator" color="#0B0B0B" assets="ICICIBANK.NS" style="font-size:18px" api="yf"]
ICICI BANK 50EMA-200EMA I Daily Timeframe
[stock_market_widget type="comparison" template="basic" color="#1D1414" assets="ICICIBANK.NS" fields="50_day_average,200_day_average" links="{'ICICIBANK.NS':{}}" display_currency_symbol="true" style="font-size:18px;" api="yf" ]
- If market trades below weekly pivot so trend is sideways to negative you should look for short trades .
- If market trades above weekly pivot so trend is sideways to positive you should look for buy trades .
- if market trades below 200 ema (30min-1 hour )then you should look for short trade and vice versa .
- Trendline chart tells you about market trend if candle trades above this market will be trending and if candle below this some negative movement possible.
- for more clearity follow our videos it will clear all your doubts.
Disclaimer:- This chart tells you about market trend and based on price action and you can use it for educational purpose . Before taking trade consult your financial advisor .we will not be responsible for your losses. Have a safe trading .