Hello, traders in this article we will explore the best swing trading indicators techniques with some tricks with a good setup.
What are the best swing trading indicators?
- Relative Strength Index (RSI) is one of the most important trading indicators that is widely used.
- Moving average (MA) (Exponential or simple moving average)
- MACD (Moving Average Convergence Divergence)
- Volume indicator
- Stochastic.
- Bollinger Band
Also Read :-
What is swing trading and how does it work?
it is also a trading style that is more powerful than day trading, this time swing trading is very popular in the terms of profit booking that means it gives you good profit when you take this type of trade. The duration of swing trading may be some days or sometimes it may go for some weeks, which means you are in the position for the next swing move when that area or swing comes you just close that trade and book your profits.
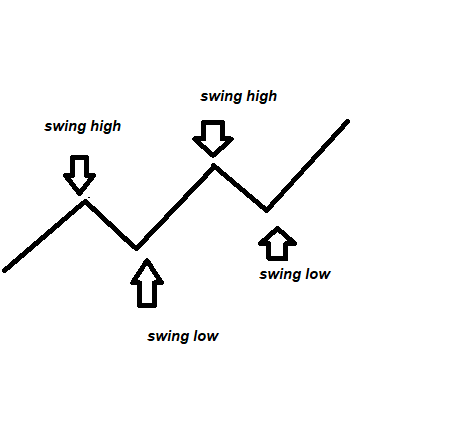
This trading strategy is totally dependent on swing highs and swing lows.
Swing high– This term is used very much in technical analysis. As I posted an image, it is showing you an uptrend means it forms in an uptrend .
when a stock or security trades a higher price after some decline and breaks the resistance that was it’s previous higher high, as I showed you above image this strategy gives you good profit when you enter near previous fall or decline price as the stock has made recently.
Swing low-when a stock or security trades lower or fall after an up move so that move or area is called as Swing low as you can check in the posted image.
There are so many traders across the world who prefer only swing trading and trade between the swing areas.
6 Best swing Trading indicators?
1. How to use Relative Strength Index (RSI):-?
The RSI is a momentum indicator so you can find it in the list of oscillators on your platform. Swing traders mostly used this indicator for finding the reversal zones by following overbought and oversold regions. This indicator shows you mainly these zones in any stock or security, RSI indicator is mostly used by crypto currency traders. RSI oscillates between 0-100 by a line graph on your chart and shows you these extremes of low and high.
What are overbought zones and oversold zones in RSI?
Overbought zones – when RSI breaks 70 levels it suggests the market is overbought and it may give you some reversal anytime .
OverSold zones- when RSI breaks 30 levels and trades below this it suggests the market is oversold and in some time or days, it may give you good reversal so you need to follow these zones.
Now, we will take an example of some security or stock with RSI zones.
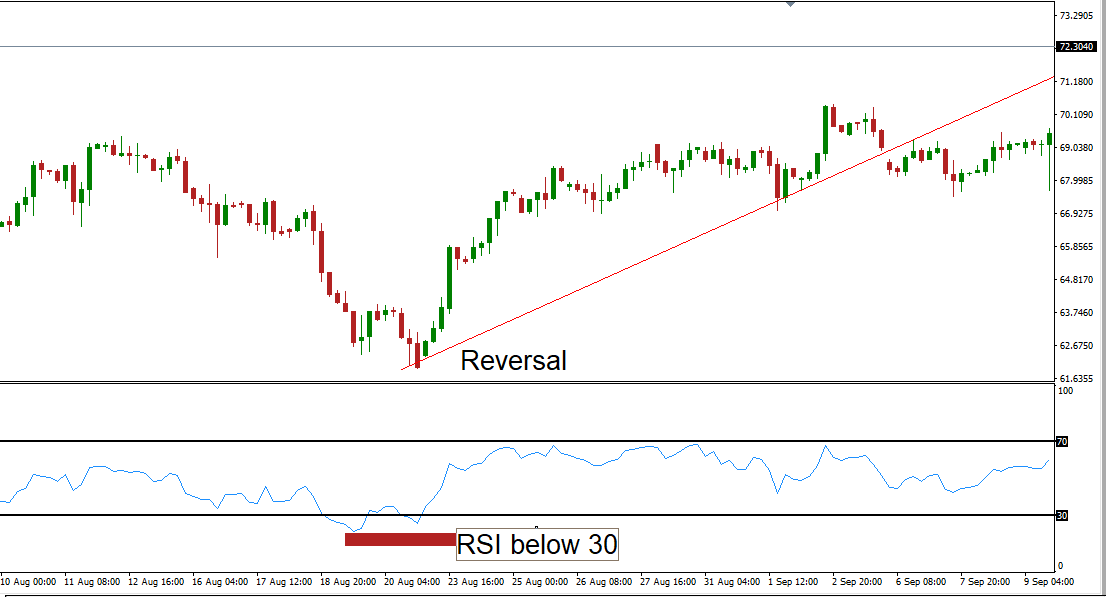
I have taken an example of usoil chart and i used a 4hours timeframe you can change the time frames according to your trading style, so you can see a good reversal after a good fall in usoil price, by this way you can find oversold zones for entry in buying side.
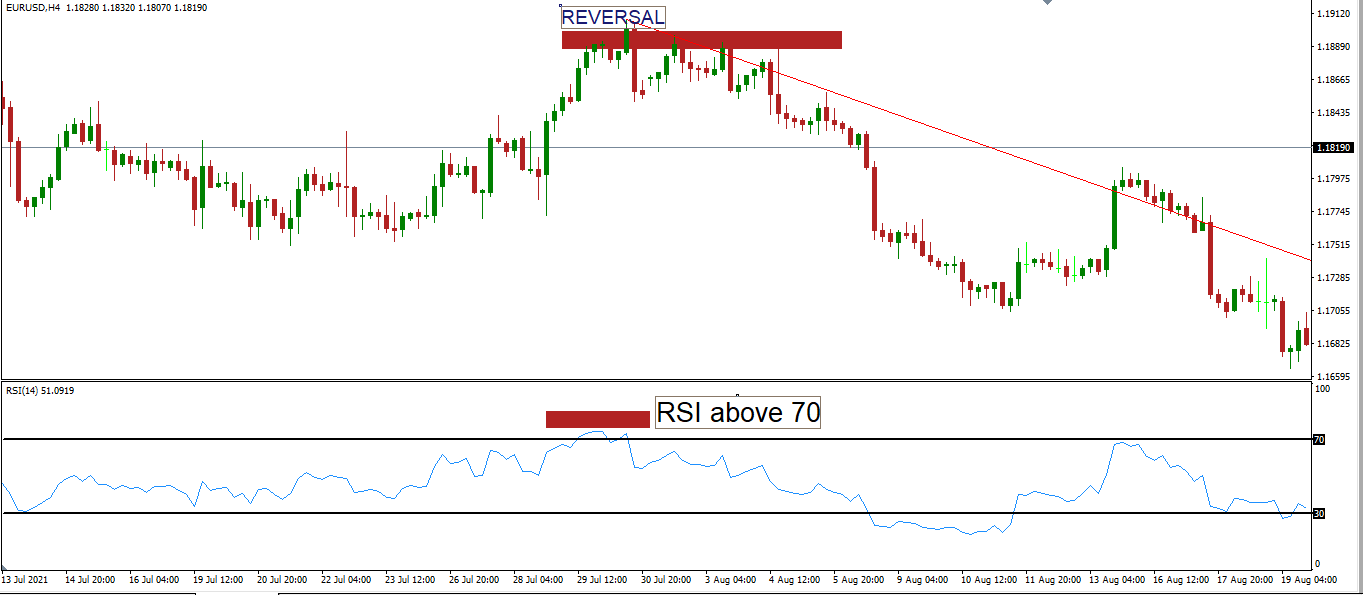
In this chart, I have taken an example for the EUR USD chart, and I used a 4hours timeframe, you can easily check when RSI breaks its 70 level zone it suggests you reversal may happen in some time and a good fall occurs in EUR USD by this way you can find the reversal point or area and you can exit near the top.
2. How to use moving average (MA) (Exponential or simple moving average)?
its the first technical indicator in trading history that is used for decades in the commodity market and also used in share to find the average move of any share.
Moving average means it tells you about the average price that takes from its previous moves. Let”s take an example if you choose 10 period means it will divide 10 candles price movement and tells you the average price, technically speaking it is based on simple mathematical calculation.
it is a lagging indicator and follows past the price moves.
In this Swing strategy, we will take 3 Ema periods or you can also take the simple moving average.
Ema period- 200 –50–20 – find Buying opportunities
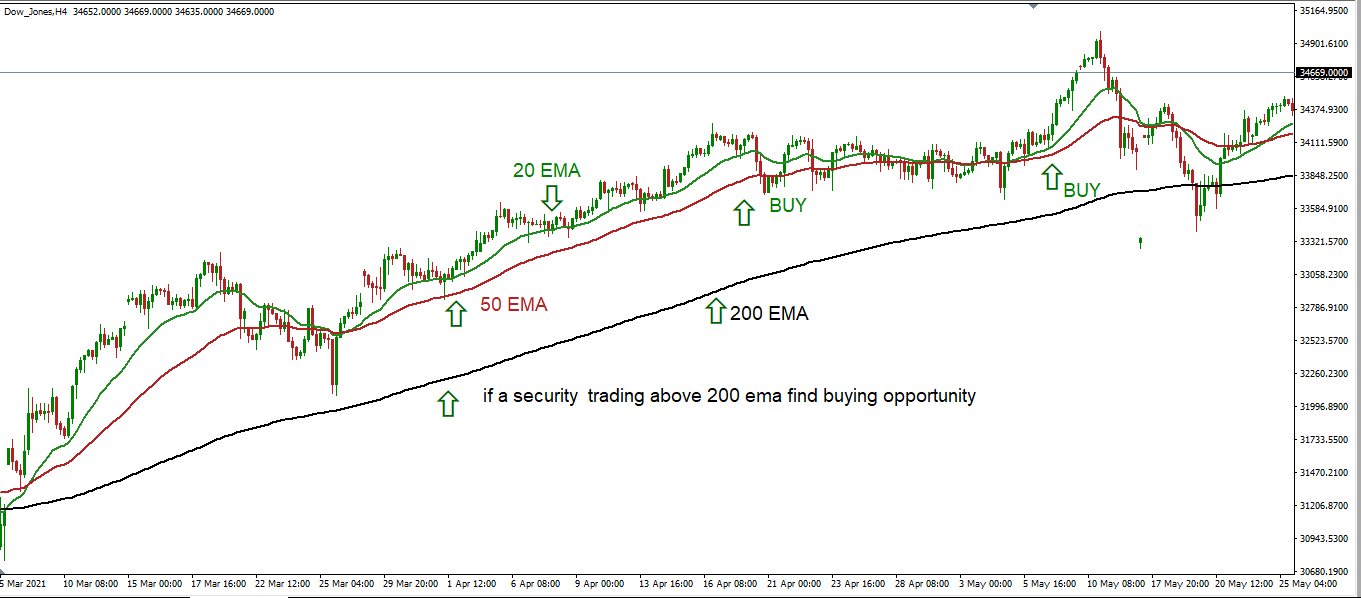
if any stock or security is trading above 200 ema it shows you an uptrend but where we can take an entry for swing move. you can use 50 -20 combinations of ma along with it for buying opportunities. Buy when 50 and 20 ema crossover each other your you can simply buy near pullback that happens near 50 ema and trail your stop loss and put your stop loss just below 50 ema, 20 ema will show you the strength of that particular stock or security.
Ema period- 200 -50-20 – find selling opportunities
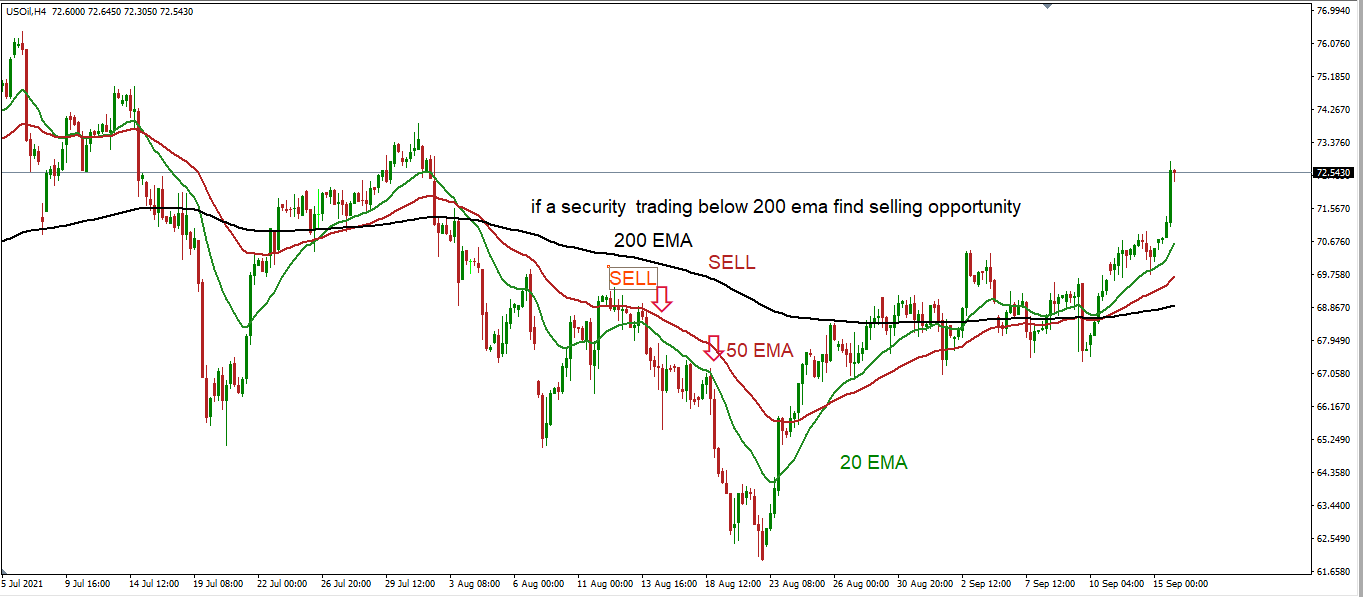
if any stock or security is trading below 200 ema it shows you a downtrend but where we can take an entry for swing move. you can use 50 -20 combinations of ma along with it for selling opportunities. sell when 50 and 20 ema crossover each other your you can simply sell near pullback that happens near 50 ema and trail your stop loss and put your stop loss just below 50 ema, 20 ema will show you the strength of that particular stock or security.
How to use MACD (Moving Average Convergence Divergence)?
MACD Formula calculation = 26 EMA-12 EMA it is calculated by subtracting 26 Ema from 12 ema its the simple formula of this.
MACD is a lagging indicator and it follows the previous action which happened in a particular stock.
A 9-day ema acts as a signal line in MACD, it is used for triggering buy and sell calls in any security and we can also find the trend of any stock by following this method. When MACD crosses the signal line that lies on 0 traders fo only for buy and if MACD goes below 0 traders go for selling opportunity.
- IF MACD above 0 – BUY
- IF MACD below 0 – SELL
I will explain this with an image and will show you how you can check the trend or buying and selling opportunity.
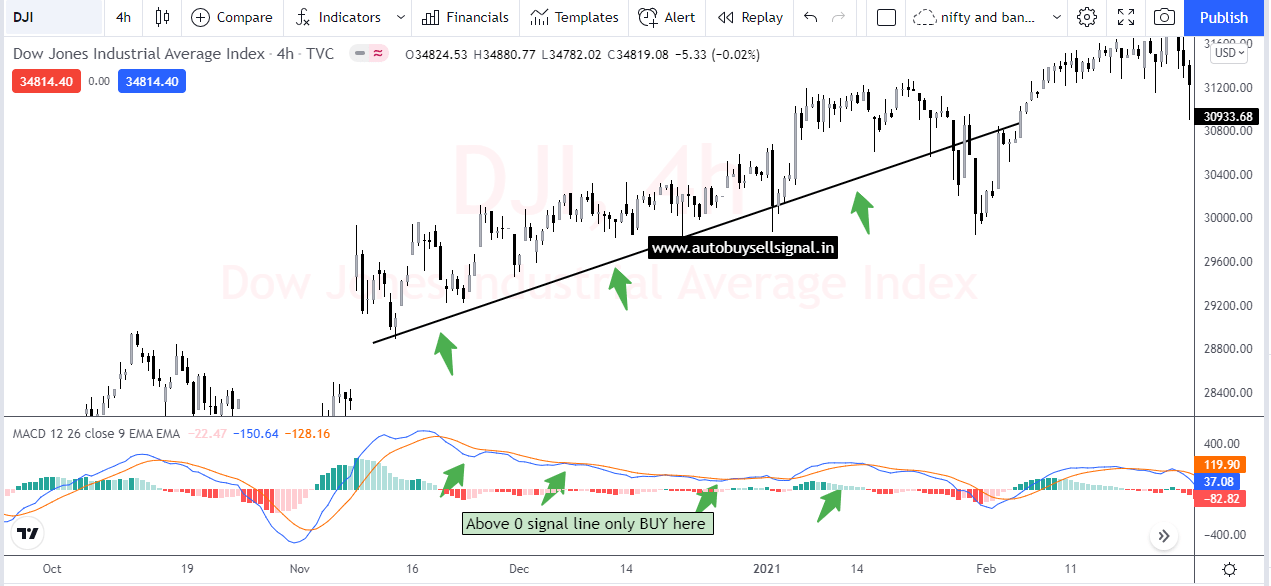
In this example, we have taken the DOW jones chart in 4 hours timeframe and I am trying to show you MACD is above 0 i.e above the signal line so, traders maybe go for buying opportunity and you can check it has risen sharply by this way you can find the trigger for buying.
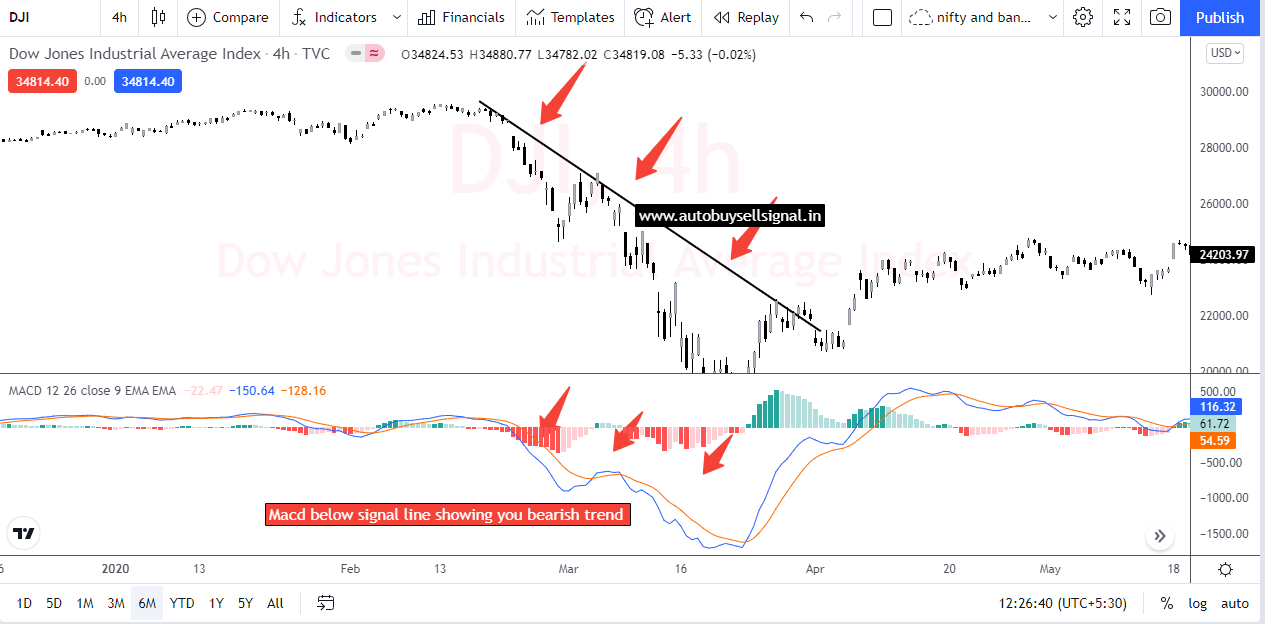
In this example, we have taken the DOW jones chart in 4 hours timeframe and I am trying to show you MACD is below 0 i.e below the signal line so, traders maybe go for selling opportunity and you can check it has fallen sharply, by this way you can find the trigger for selling.
4. How to use Volume indicator?
Swing traders also follow the volume indicator it’s available in all major charting platforms like MT4, Amibroker, Tradingview you can simply search volume and apply it on any chart it will show you the real-time volume.
Many traders used it with the breakout strategy, like when any stock breaks its resistance with good volume a new trend is going to happen in that particular stock.
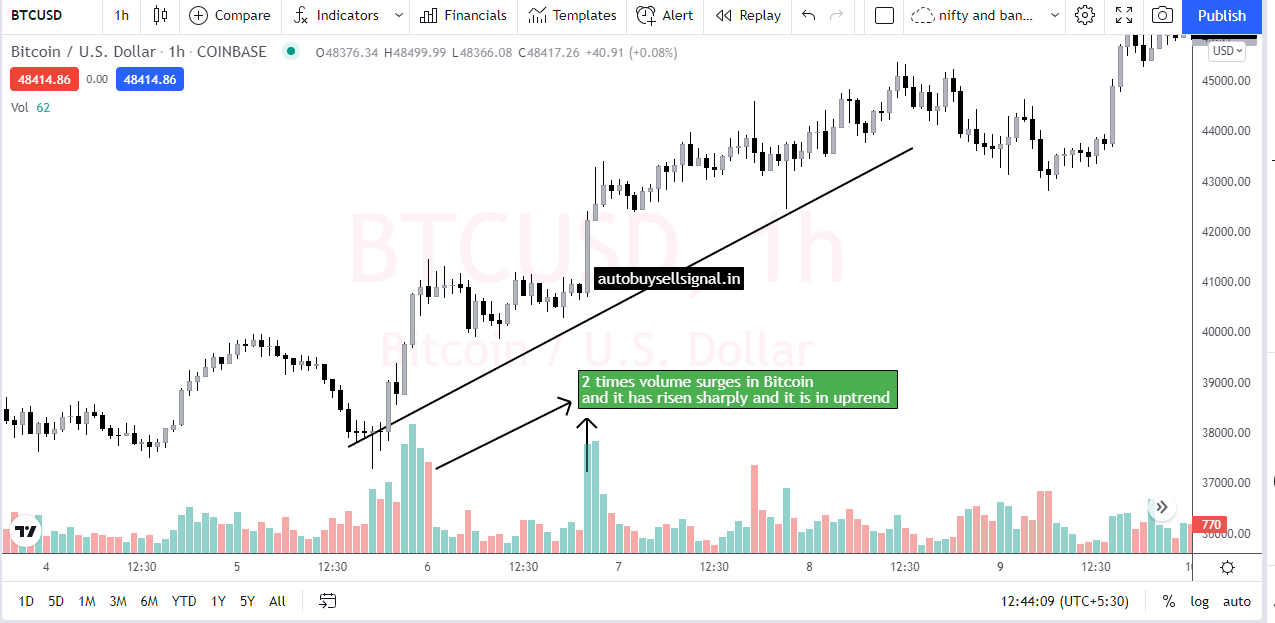
This volume indicator shows you the strength of any stock, I have taken an example of bitcoin 1-hour timeframe, volume is showing you trend reversal and breakout, if the volume is higher then the trend is also strong, follow the image.
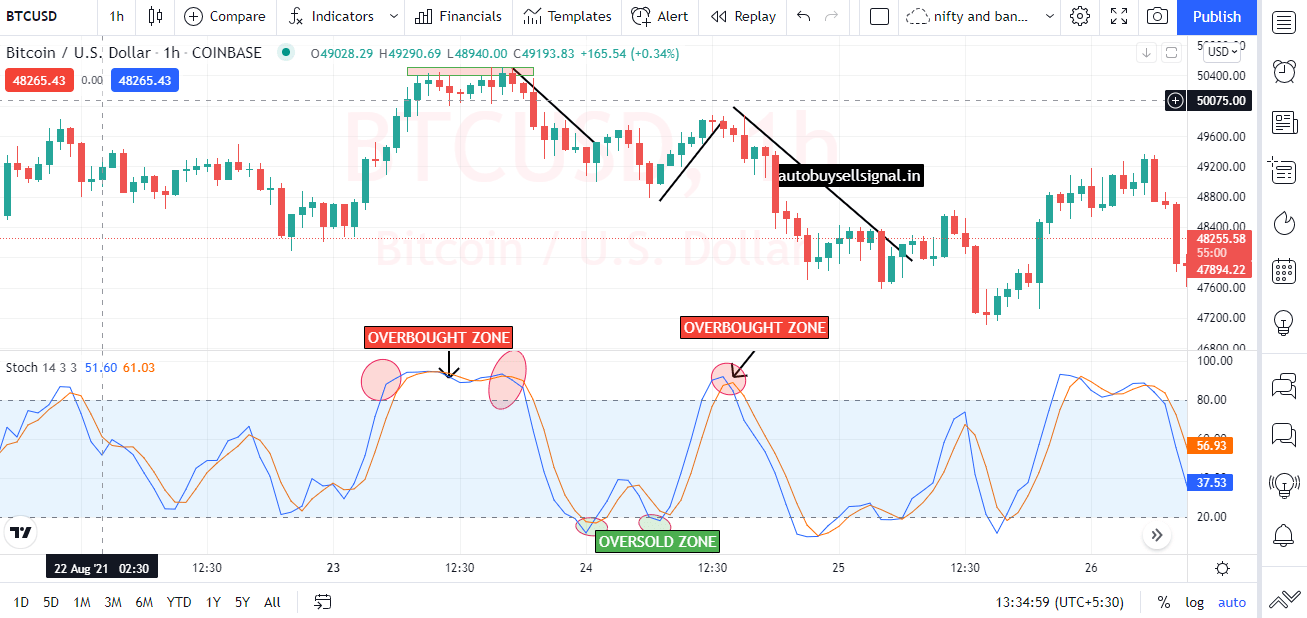
5. How to use Stochastic indicator?
it is also a momentum indicator, it is similar to RSI but it follows different calculations. It works on the closing price of any security and compares it with the closing price over a certain period. It lies between 0 to 100, if any security is trading above 80 levels,it suggests that the price or trend may be overbought and you need to go for sell or exit from buy position.
if any security is trading below 20 levels, it suggests that the price or trend may be oversold and you need to go for buy and exit from a short position.
Traders also look at two lines crossover for trend reversal.
6. How to use Bollinger bands indicator?
it is also a momentum indicator with 3 lines. first, one is moving average, and the rest 2 lines are standard deviations. If a swing trader quickly finds the trend they use Bollinger bands. This indicator finds three things on the chart overbought, oversold, and volatility also.
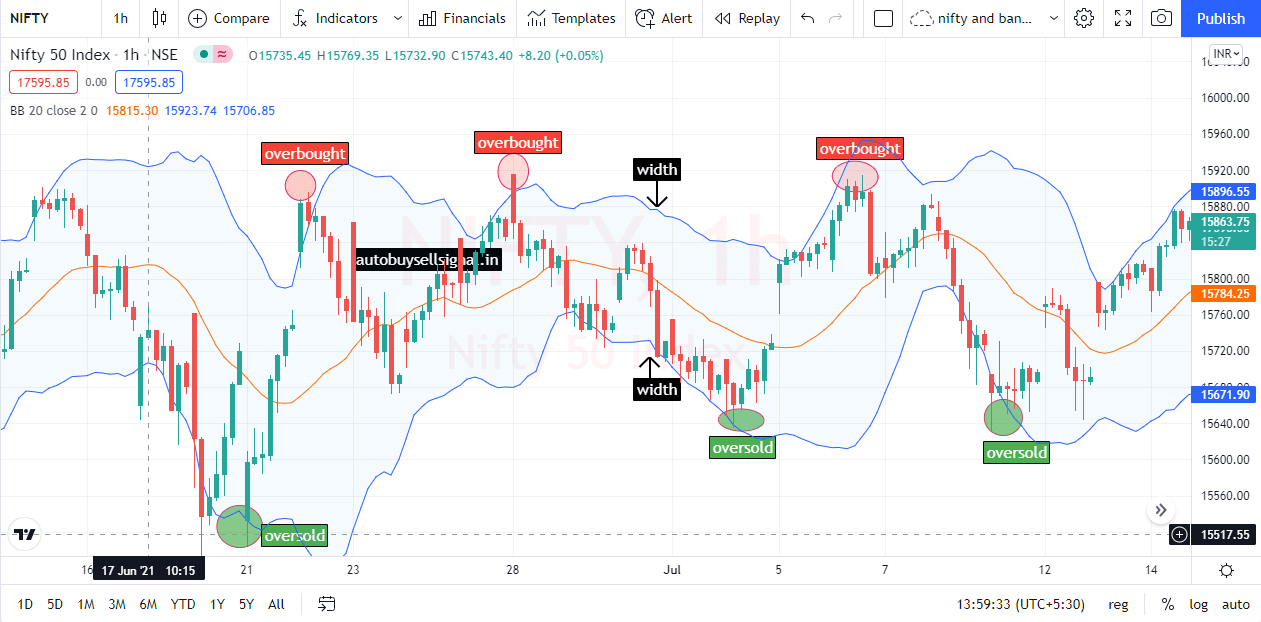
if the width of bands is closer to each other it shows you lower volatility and market is calm down, vice versa if the width of bands are far away from each other it is showing that market is too volatile.
There is a super technique that swing traders use Bollinger bands on their chart, when the market trades in a range as you can follow the above image when it touches the upper band you may go for short and if the price touches the lower band you may go for buy, by this way you can take the benefit of this indicator.
Note:- if the width of the band starts expanding please be aware because it may cause trend reversal and you cant trade like the rangebound market.
Some Best Swing Trading Tools and techniques?
As we have explained all good indicators that a swing trader uses but you can make it more powerful by applying or combine some tools with the above-listed indicators.
Chart Patterns
Swing traders also follow some trend continuation patterns and some reversal patterns on the chart along with indicators.
Continuation patterns are as follows:- rectangles, triangles, pennants, and flag patterns.
Reversal patterns are as follows:- Double tops, Double bottoms, and Head and shoulder patterns.
Support and Resistance Lines
Swing traders also follow and track the support areas and resistance areas.
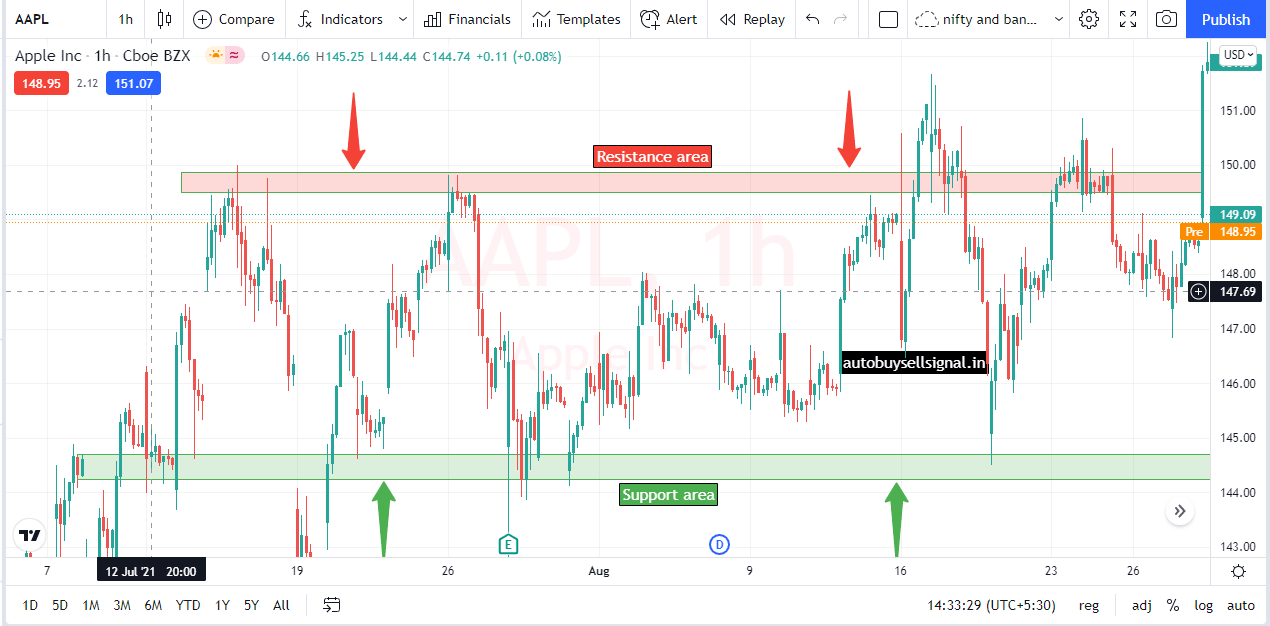
When a security is trading near its resistance area you may go for short.
When a security is trading near its support area you may go for buy.
Conclusion:-
Swing trading is a good trading style for the beginner as well as an experienced trader and these indicators helps us to make a better decision for trading. But, you need to follow a Risk management system and apply a stop loss as per your risk capacity. Nothing is 100 percent accurate in trading but we need to follow technical indicators with a combination of price action techniques for better result.