Pivot point indicator
- the pivot point is a simple price action indicator
- it is based on pivot point formula you can see our post how to calculate this formula I have explained in my previous post
- in this indicator, we have added some code and gives you the supply zone and demand zone based on R1 R2 , S1 S2, and so on
- Demand zone – in this zone buyers takes place buy call in dips it is mainly seen at the support area .
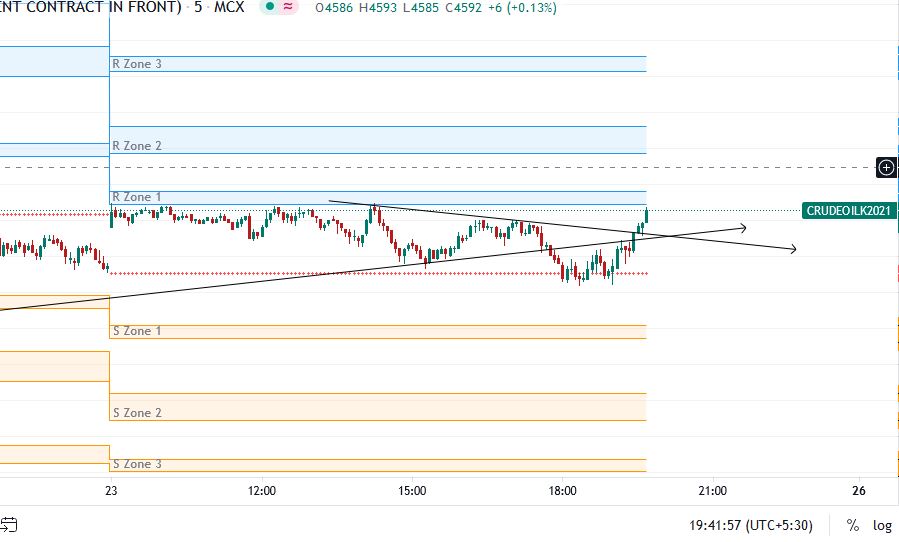
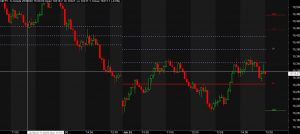
in the above image yo can clearly see there are so many zones like Szone and Rzone so,
SZone means – Support area / Demand area if support breaks it works as a resistance
RZone means – Resistance area / Supply zone if resistance breaks it works as a support
Now , what is support are and resistance area? or supply zone and demand zone
if you have position in buy side and if you want to book your profit then you can book your targets near r1 means resistance are or supply zone . If r1 crossed then you can trail your stop loss and you can book your targets near r2 so on .
If you have position in sell side or short position so you can book your profits near s1 and so on .
Read more :-
How to apply in tradingview ?
- simply download this code after 20 seconds of timer
- open tadingview.com
- open pine editor click on new indicator script delete all data if there anything
- simply paste this code and save and add to chart Enjoy .
Wait 20 second for downlaod link and scroll below and click on download file to download