- in this indicator JFT ZONES you got weekly and monthly zones
- first one weekly zone that is important for short term trend of a stock

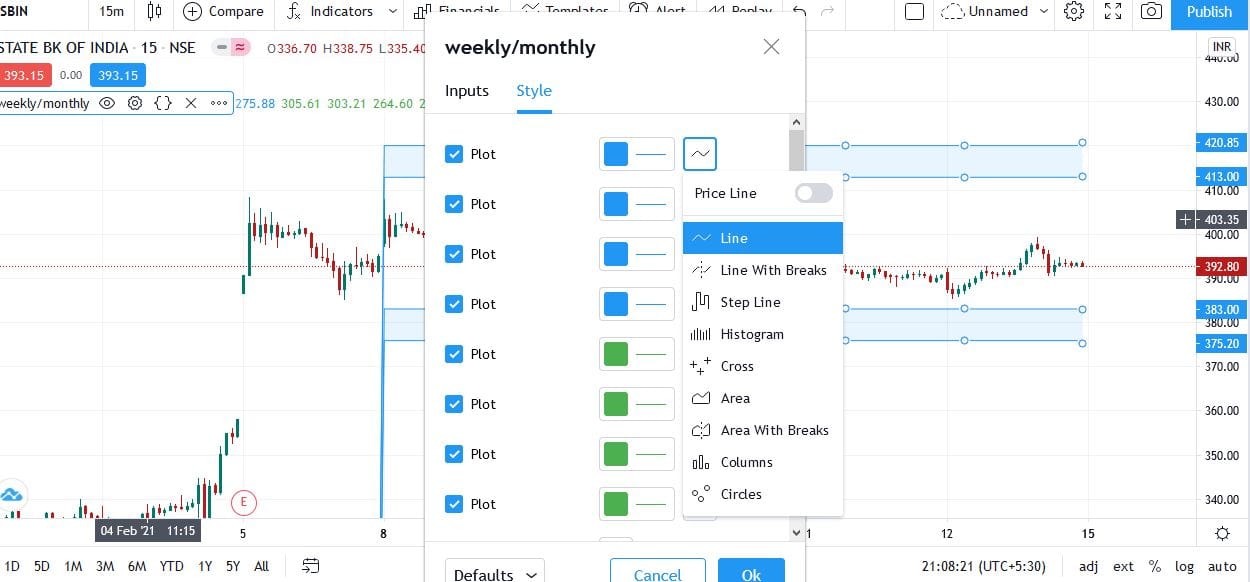
- just do the setting as you can see in the image changes styles to circles for dotted support and resistance otherwise you can use it as it is.
- why we need these weekly zones -if you are a positional trader then you will easily find support and resistance that intact for somedays like 5-10 days or more because we are analyzing weekly zones and timeframe, which is slightly high from day trading.
- the same thing will apply for monthly zones if you are a short-term trader and you hold the stock for almost 1 month 2 months so you should look monthly zones area and it gives you support and resistance for the short term.
- first, you need to backtest this whole. strategy for almost some days or months because for all strategy and method you need to give your time then it will work for you don’t take stock market is very easy its very hard to learn so give your time to the stock market and it will return more
Download from below given link and.
It’s a paid indicator .. so don’t go for buy now I am providing you in free …
how to plot JFT ZONES in tradingview
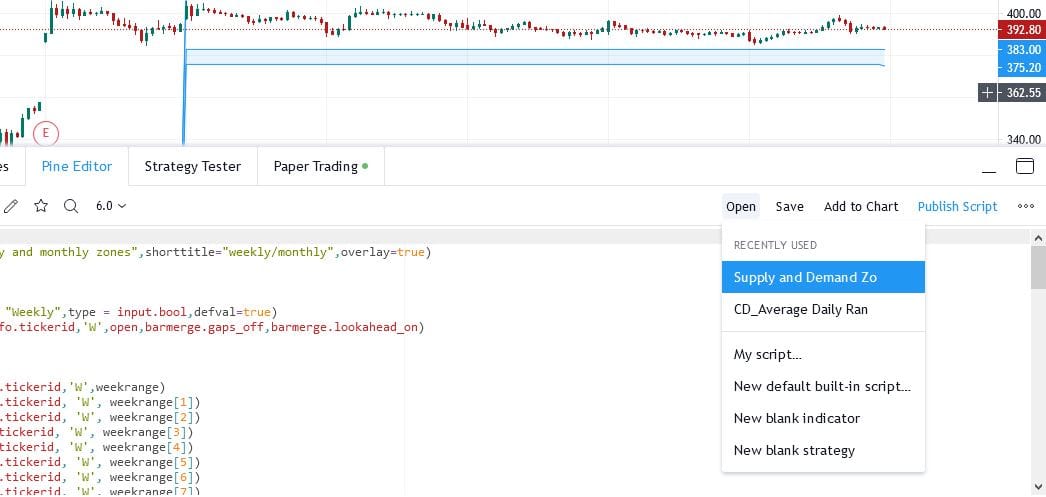
open your pine editor .. and open blank indicator strategy and paste this code and save this and you will see in my scripts and .. you can also use this on mobile.

- click on the new blank indicator delete and clear the window and paste the downloaded code and simply save and it will show you in your favorites script.
“MUST READ”
“for more trading view indicator”
Best Paid Trading view indicator


