VWAP indicator for Amibroker I vwap indicator for intraday
VWAP indicator: Volume weighted Average Price it tells you about the average price of a security or a stock or futures traded a whole day.
It provides the trend of that particular security (it may be anything like stock, futures).
It is based on volume and price that”s why it gives you a valuable price that anyone can be trade basis on this.
It”s a very important indicator right now in the trading field.
Most traders used this indicator for finding the market trend.
Most intraday traders use this indicator for quick decisions for taking trades.
How to plot this indicator?
if you use any type of trading terminals like Zerodha, Alice blue, Stoxkart, and anyone Platform like Tradingview, Amibroker any of one you can use it it’s very easy to plot on the chart.
Step1: open https://kite.zerodha.com/
log in with your user id and password open any chart it should be any security click on indicators and search for VWAP
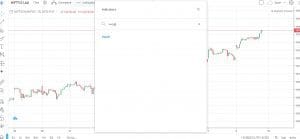
in the image, you can clearly see how to plot the VWAP indicator in Zerodha
in all the platforms you can do the same like that.
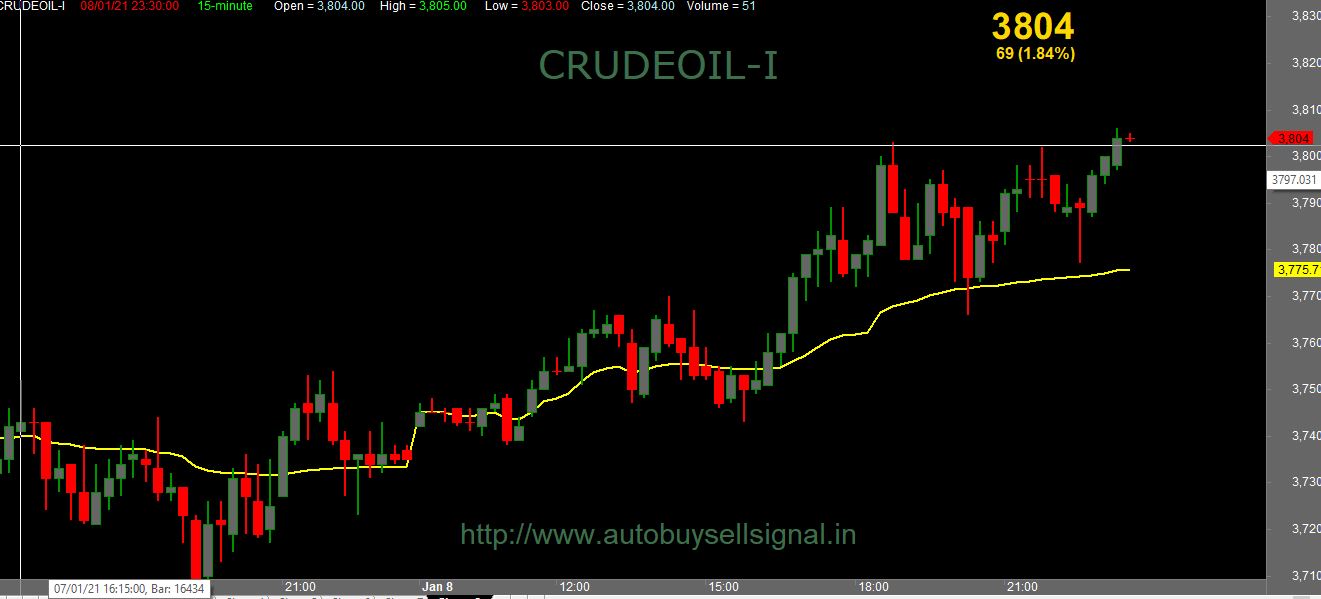
How to plot in Amibroker?

Nowadays many traders and financial institution use this software for analyzing market behaviour.
How to plot VWAP in amibroker so for this you need an AFL means a formula that uses in Amibroker so in this post I will provide you with an AFL file and you can easily plot this indicator on amibroker.In the above image, you can clearly see the image where I have plotted this indicator. free vwap indicator download below.
How to generate signals?
There are many ways to generate signals by applying this indicator if you use it alone it will not give you good results you can combine it with some other indicators like moving average crossovers, PIvot points, Support resistance.
Many indicators you can use for this you need some practice for some days and create a new rule I am showing you a rule-based on a pivot point.
VWAP WITH PIVOT POINT?
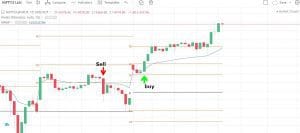
see this image I have plotted this two indicator and generate a buy and sell signal
The rule for Buy– when a candle closes above vwap and should be above R1 or pivot point.The rule for Sell– When the candle closes below vwap and should be below pivot or S1.
you can also combine this with ema crossover.
Trade with Stoploss
Practice as much as you can do for clear things in a live market.
Always trade with strict stop loss .
Make a money management rule for any trading techniques and follow your own rule.
“Must read:1. Best intraday strategy”
3.Best Paid Trading view indicator
4.Free Realtime Buy sell signals