
Bank Nifty Pivot Levels I Forecast I Target
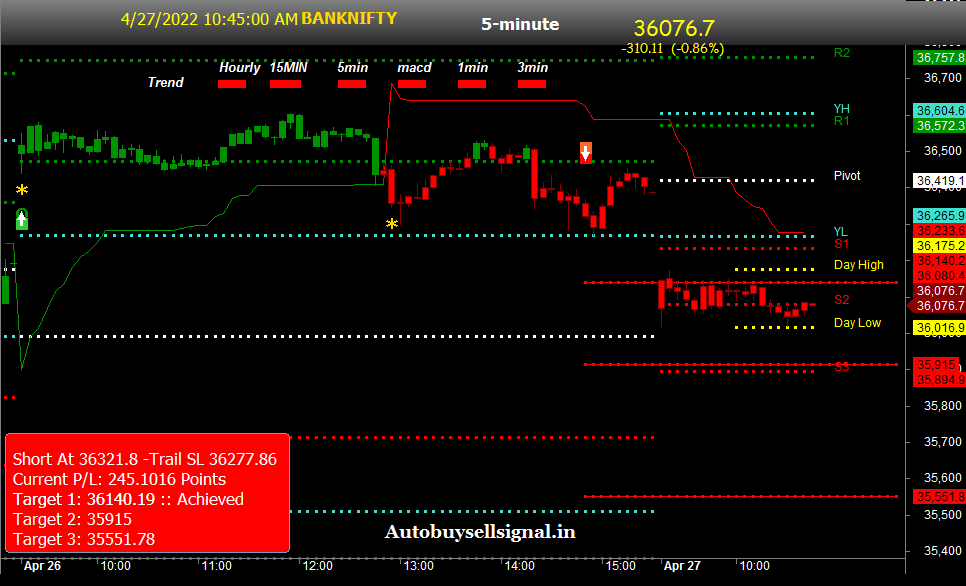
Bank Nifty Support and Resistance
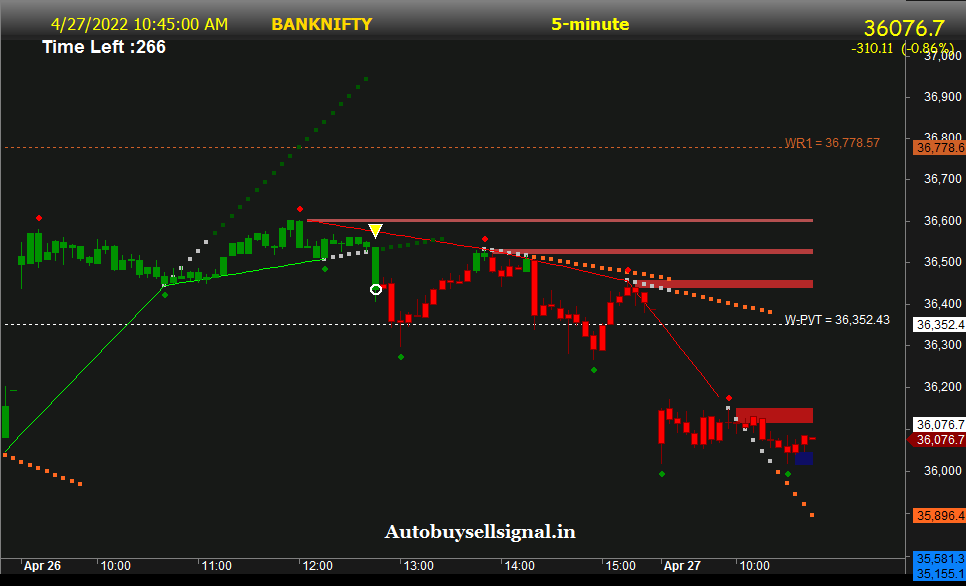
Banknifty Demand and supply Zone
- in this post, we will discuss about live banknifty support and resistance that works for finding buying zone and selling zone of banknifty.
- This whole data is taken from each strike price of banknifty and calculation only based on this.
- This Live data gives you where the strong support of banknifty is and where is the strong resistance of banknifty in the current situation.
- if you are an options trader so you must check these levels for finding quick trading opportunities in options strike.
- if you will check options data on NSE India website you would surprise that its gives you quick data about the support and resistance of banknifty after calculating its open interest data and change in open interest data. you can crosscheck this data.
- Now we will talk about banknifty Max Pain data what this data says you it simply tells you about where this expiry will end.
- This means if Max pain is 35300 so we can assume this expiry ends near this strike price.
- Strongest support – Strongest support means recent support or recent build-up in 2-3 days.
- Strengthening support – Means major support banknifty can’t go below this huge build-up on that strike price.
- Strongest resistance – Strongest resistance means recent resistance or recent selling happening in 2-3 days.
- Strengthening resistance – Means major resistance banknifty cant go above this huge selling happening on that strike price.
Banknifty future Live Technical analysis/nifty buy sell signal
mcx live 24,mcx live data,mcxdata,free real time mcx commodity charts,mcx live charts with technical indicators,
Disclaimer:- This chart tells you about market trend and based on price action and you can use it for educational purpose . Before taking trade consult your financial advisor .we will not be responsible for your losses. Have a safe trading .
Share this:
- Click to share on Twitter (Opens in new window)
- Click to share on Facebook (Opens in new window)
- Click to share on LinkedIn (Opens in new window)
- Click to share on Tumblr (Opens in new window)
- Click to share on Pinterest (Opens in new window)
- Click to share on Telegram (Opens in new window)
- Click to share on WhatsApp (Opens in new window)
